| Red | Green | Blue | |
| z | 17.64 | ||
| znorm | Inf | ||
| sky | -Inf | -Inf | -Inf |
| S/N | 27.4 | 49.9 | 53.7 |
| S/N(c) | 0.0 | 0.0 | 0.0 |
| SN(E/C) |
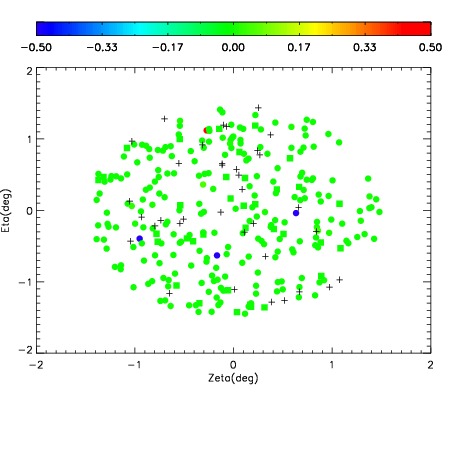
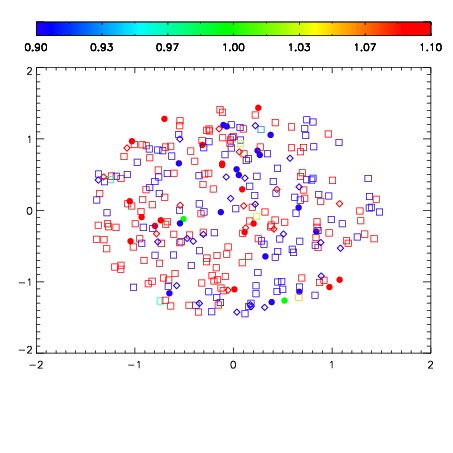
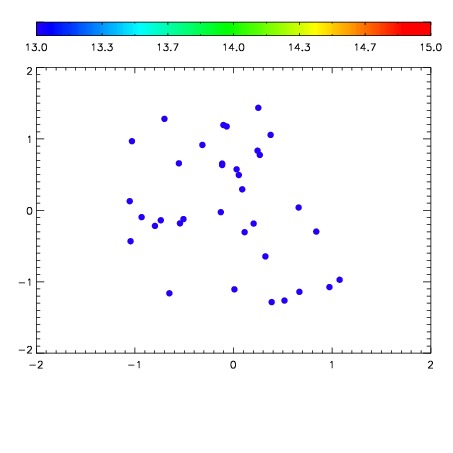

| Frame | Nreads | Zeropoints | Mag plots | Spatial mag deviation | Spatial sky 16325A emission deviations (filled: sky, open: star) | Spatial sky continuum emission | Spatial sky telluric CO2 absorption deviations (filled: H < 10) | |||||||||||||||||||||||
| 0 | 0 |
|
|
|
|
|
|
| IPAIR | NAME | SHIFT | NEWSHIFT | S/N | NAME | SHIFT | NEWSHIFT | S/N |
| 0 | 11150063 | 0.484227 | 0.00000 | 176.028 | 11150065 | 0.000131876 | 0.484095 | 175.868 |
| 1 | 11150062 | 0.483300 | 0.000927001 | 178.811 | 11150061 | 0.00000 | 0.484227 | 185.146 |
| 2 | 11150071 | 0.483146 | 0.00108099 | 177.066 | 11150064 | -0.000237353 | 0.484464 | 179.524 |
| 3 | 11150066 | 0.482547 | 0.00168002 | 175.632 | 11150072 | -5.66071e-05 | 0.484284 | 173.690 |
| 4 | 11150067 | 0.483419 | 0.000808001 | 173.890 | 11150069 | 0.00152063 | 0.482706 | 172.916 |
| 5 | 11150070 | 0.483099 | 0.00112799 | 171.753 | 11150068 | 0.00125168 | 0.482975 | 171.417 |