| Red | Green | Blue | |
| z | 17.64 | ||
| znorm | Inf | ||
| sky | -Inf | -Inf | -Inf |
| S/N | 21.5 | 36.9 | 42.7 |
| S/N(c) | 0.0 | 0.0 | 0.0 |
| SN(E/C) |
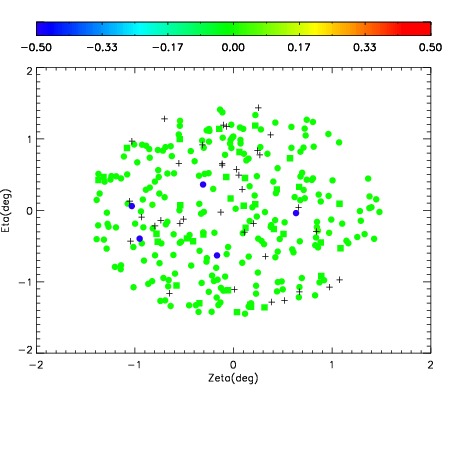
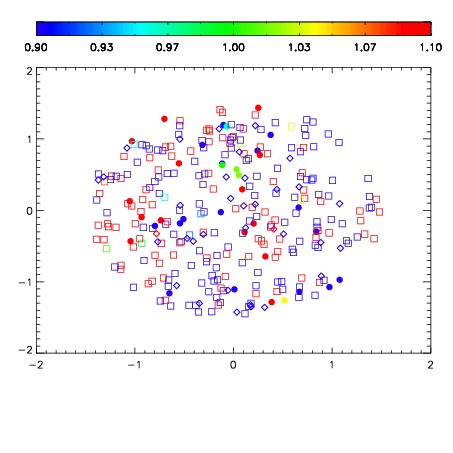


| Frame | Nreads | Zeropoints | Mag plots | Spatial mag deviation | Spatial sky 16325A emission deviations (filled: sky, open: star) | Spatial sky continuum emission | Spatial sky telluric CO2 absorption deviations (filled: H < 10) | |||||||||||||||||||||||
| 0 | 0 |
|
|
|
|
|
|
| IPAIR | NAME | SHIFT | NEWSHIFT | S/N | NAME | SHIFT | NEWSHIFT | S/N |
| 0 | 11360076 | 0.478703 | 0.00000 | 165.721 | 11360078 | -0.00300731 | 0.481710 | 167.324 |
| 1 | 11360080 | 0.478647 | 5.59986e-05 | 171.296 | 11360081 | -0.00255594 | 0.481259 | 176.325 |
| 2 | 11360079 | 0.477522 | 0.00118101 | 168.898 | 11360077 | -0.00313581 | 0.481839 | 170.251 |
| 3 | 11360075 | 0.478134 | 0.000568986 | 146.469 | 11360074 | 0.00000 | 0.478703 | 69.8970 |