| Red | Green | Blue | |
| z | 17.64 | ||
| znorm | Inf | ||
| sky | -Inf | -Inf | -Inf |
| S/N | 25.0 | 42.0 | 48.9 |
| S/N(c) | 0.0 | 0.0 | 0.0 |
| SN(E/C) |
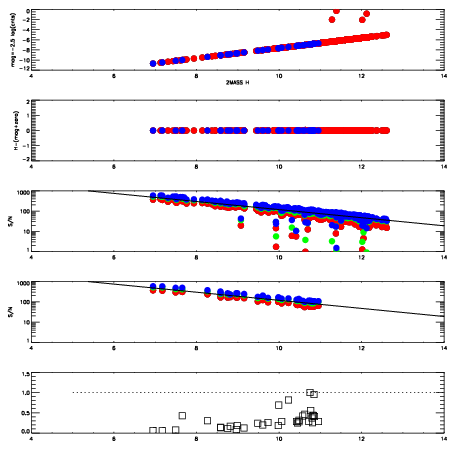
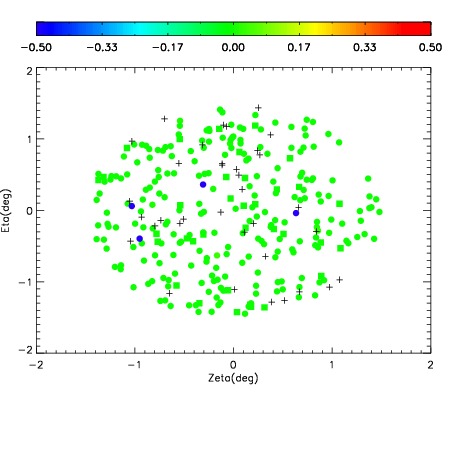
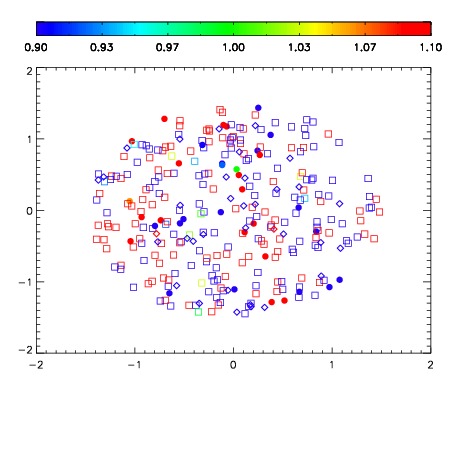
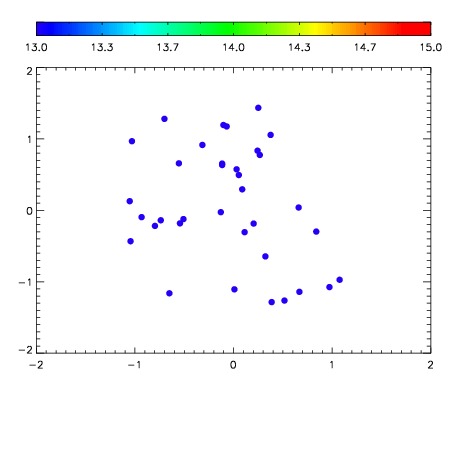

| Frame | Nreads | Zeropoints | Mag plots | Spatial mag deviation | Spatial sky 16325A emission deviations (filled: sky, open: star) | Spatial sky continuum emission | Spatial sky telluric CO2 absorption deviations (filled: H < 10) | |||||||||||||||||||||||
| 0 | 0 |
|
|
|
|
|
|
| IPAIR | NAME | SHIFT | NEWSHIFT | S/N | NAME | SHIFT | NEWSHIFT | S/N |
| 0 | 11380072 | 0.471414 | 0.00000 | 177.529 | 11380073 | -0.00310839 | 0.474522 | 183.210 |
| 1 | 11380071 | 0.470520 | 0.000894010 | 188.361 | 11380070 | 0.00000 | 0.471414 | 186.714 |
| 2 | 11380076 | 0.469842 | 0.00157201 | 172.827 | 11380074 | -0.00314371 | 0.474558 | 180.389 |
| 3 | 11380075 | 0.469999 | 0.00141501 | 171.558 | 11380077 | -0.00139301 | 0.472807 | 169.787 |