| Red | Green | Blue | |
| z | 17.64 | ||
| znorm | Inf | ||
| sky | -Inf | -Inf | -Inf |
| S/N | 23.1 | 41.6 | 45.9 |
| S/N(c) | 0.0 | 0.0 | 0.0 |
| SN(E/C) |
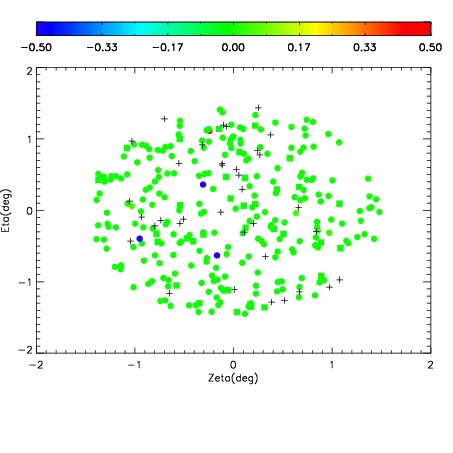
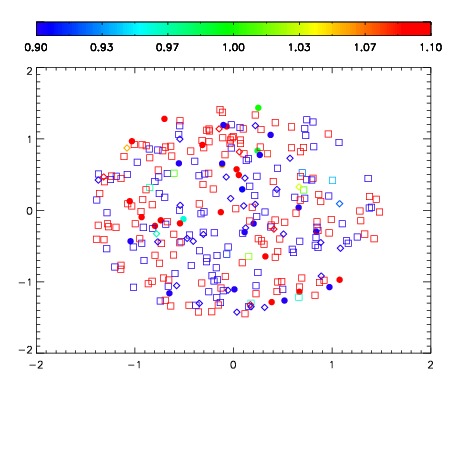
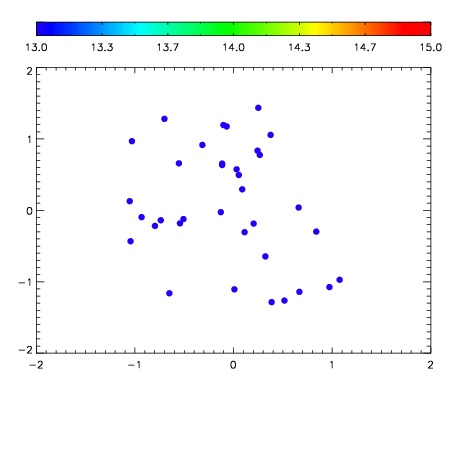

| Frame | Nreads | Zeropoints | Mag plots | Spatial mag deviation | Spatial sky 16325A emission deviations (filled: sky, open: star) | Spatial sky continuum emission | Spatial sky telluric CO2 absorption deviations (filled: H < 10) | |||||||||||||||||||||||
| 0 | 0 |
|
|
|
|
|
|
| IPAIR | NAME | SHIFT | NEWSHIFT | S/N | NAME | SHIFT | NEWSHIFT | S/N |
| 0 | 11430041 | 0.481546 | 0.00000 | 191.936 | 11430042 | -0.00175433 | 0.483300 | 189.456 |
| 1 | 11430040 | 0.481504 | 4.20213e-05 | 195.355 | 11430039 | 0.00000 | 0.481546 | 191.595 |
| 2 | 11430044 | 0.481097 | 0.000449002 | 191.805 | 11430043 | -0.000703303 | 0.482249 | 185.818 |
| 3 | 11430045 | 0.481197 | 0.000349015 | 184.347 | 11430046 | -0.00249006 | 0.484036 | 133.061 |