| Red | Green | Blue | |
| z | 17.64 | ||
| znorm | Inf | ||
| sky | -Inf | -Inf | -Inf |
| S/N | 24.6 | 41.2 | 45.2 |
| S/N(c) | 0.0 | 0.0 | 0.0 |
| SN(E/C) |
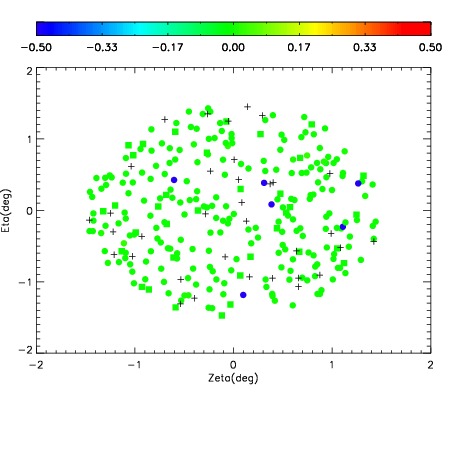
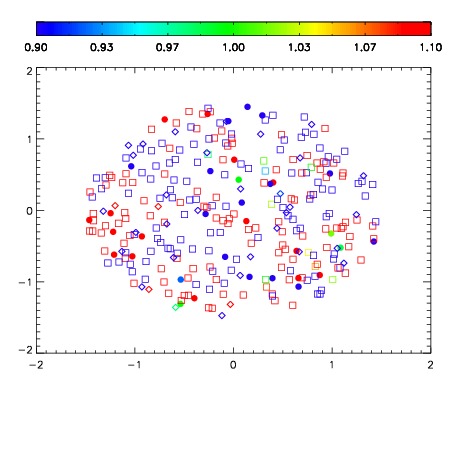
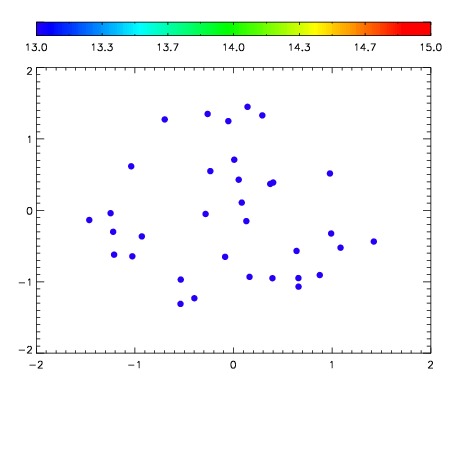

| Frame | Nreads | Zeropoints | Mag plots | Spatial mag deviation | Spatial sky 16325A emission deviations (filled: sky, open: star) | Spatial sky continuum emission | Spatial sky telluric CO2 absorption deviations (filled: H < 10) | |||||||||||||||||||||||
| 0 | 0 |
|
|
|
|
|
|
| IPAIR | NAME | SHIFT | NEWSHIFT | S/N | NAME | SHIFT | NEWSHIFT | S/N |
| 0 | 11430029 | 0.482166 | 0.00000 | 193.136 | 11430031 | -0.00118394 | 0.483350 | 191.336 |
| 1 | 11430033 | 0.480702 | 0.00146398 | 202.843 | 11430035 | -0.00239036 | 0.484556 | 198.975 |
| 2 | 11430034 | 0.481362 | 0.000804007 | 198.411 | 11430032 | -0.000267452 | 0.482433 | 197.903 |
| 3 | 11430030 | 0.482058 | 0.000108004 | 185.294 | 11430028 | 0.00000 | 0.482166 | 181.404 |