| Red | Green | Blue | |
| z | 17.64 | ||
| znorm | Inf | ||
| sky | -Inf | -NaN | -Inf |
| S/N | 27.1 | 46.3 | 51.3 |
| S/N(c) | 0.0 | 0.0 | 0.0 |
| SN(E/C) |

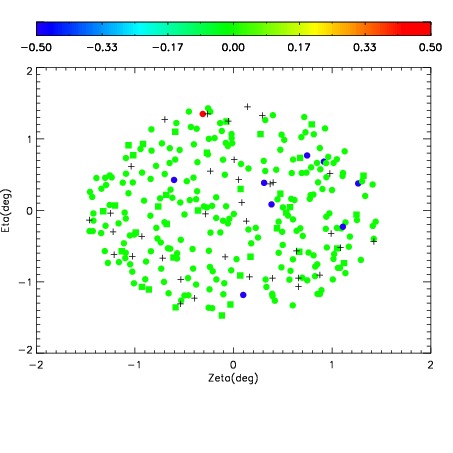
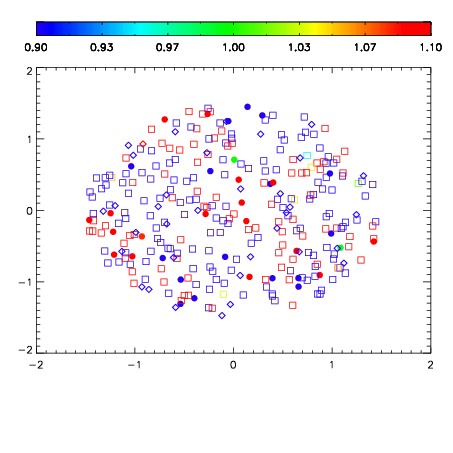


| Frame | Nreads | Zeropoints | Mag plots | Spatial mag deviation | Spatial sky 16325A emission deviations (filled: sky, open: star) | Spatial sky continuum emission | Spatial sky telluric CO2 absorption deviations (filled: H < 10) | |||||||||||||||||||||||
| 0 | 0 |
|
|
|
|
|
|
| IPAIR | NAME | SHIFT | NEWSHIFT | S/N | NAME | SHIFT | NEWSHIFT | S/N |
| 0 | 11710050 | 0.487111 | 0.00000 | 213.416 | 11710051 | -0.00325122 | 0.490362 | 210.940 |
| 1 | 11710053 | 0.486498 | 0.000613004 | 213.934 | 11710048 | 0.00000 | 0.487111 | 211.940 |
| 2 | 11710054 | 0.486411 | 0.000699997 | 211.525 | 11710055 | -0.00200990 | 0.489121 | 208.774 |
| 3 | 11710049 | 0.486855 | 0.000256002 | 209.926 | 11710052 | -0.00359833 | 0.490709 | 208.397 |