| Red | Green | Blue | |
| z | 17.64 | ||
| znorm | Inf | ||
| sky | -NaN | -NaN | -Inf |
| S/N | 12.3 | 23.8 | 25.5 |
| S/N(c) | 0.0 | 0.0 | 0.0 |
| SN(E/C) |
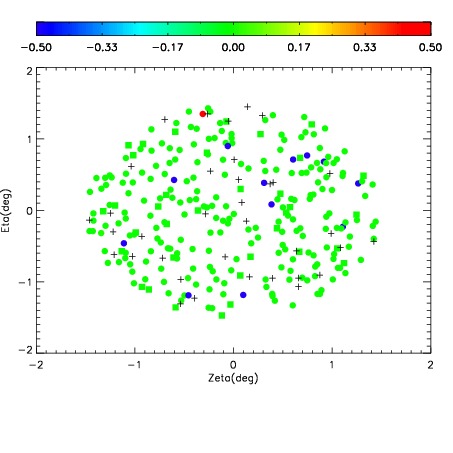
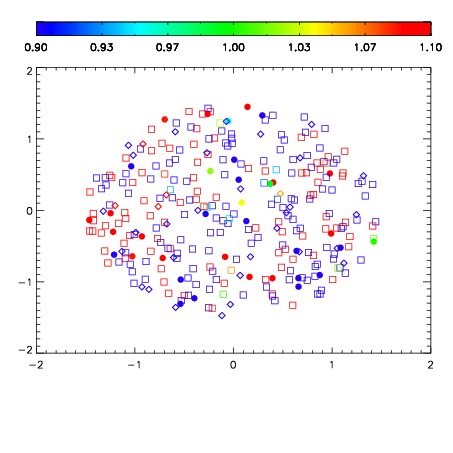
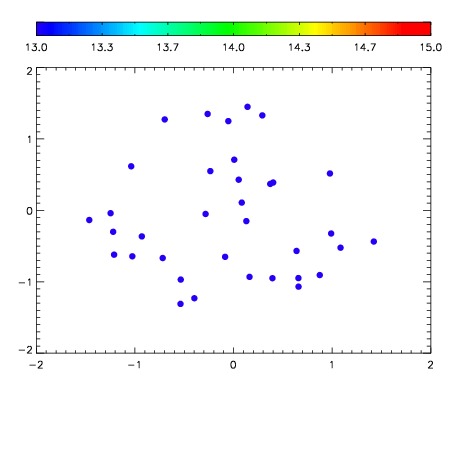

| Frame | Nreads | Zeropoints | Mag plots | Spatial mag deviation | Spatial sky 16325A emission deviations (filled: sky, open: star) | Spatial sky continuum emission | Spatial sky telluric CO2 absorption deviations (filled: H < 10) | |||||||||||||||||||||||
| 0 | 0 |
|
|
|
|
|
|
| IPAIR | NAME | SHIFT | NEWSHIFT | S/N | NAME | SHIFT | NEWSHIFT | S/N |
| 0 | 11760012 | 0.492266 | 0.00000 | 126.638 | 11760013 | -0.00391270 | 0.496179 | 128.630 |
| 1 | 11760015 | 0.491134 | 0.00113201 | 144.976 | 11760010 | 0.00000 | 0.492266 | 155.911 |
| 2 | 11760016 | 0.491892 | 0.000373989 | 134.094 | 11760017 | -0.00434366 | 0.496610 | 146.464 |
| 3 | 11760011 | 0.492160 | 0.000106007 | 111.419 | 11760014 | -0.00354786 | 0.495814 | 126.452 |