| Red | Green | Blue | |
| z | 17.64 | ||
| znorm | Inf | ||
| sky | -Inf | -Inf | -Inf |
| S/N | 33.7 | 57.5 | 64.4 |
| S/N(c) | 0.0 | 0.0 | 0.0 |
| SN(E/C) |
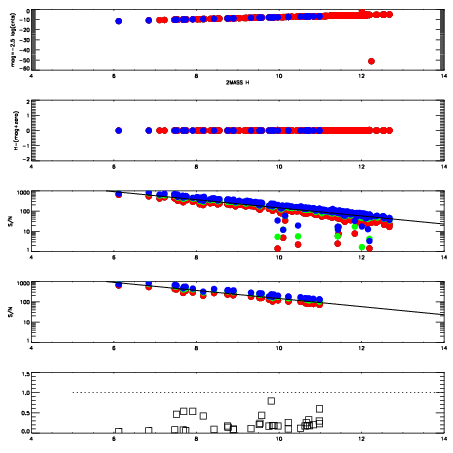
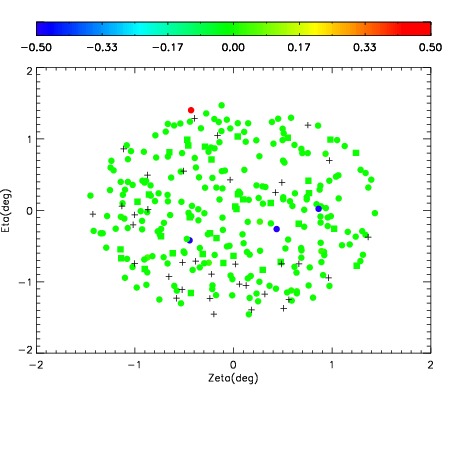
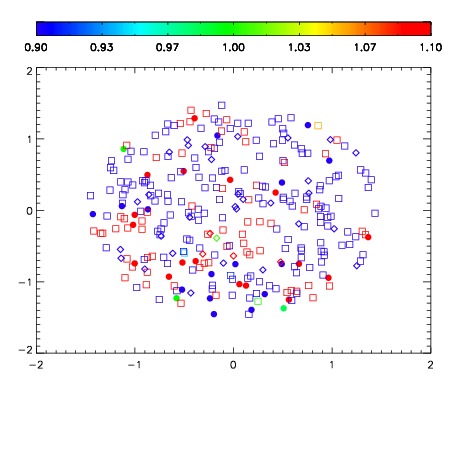
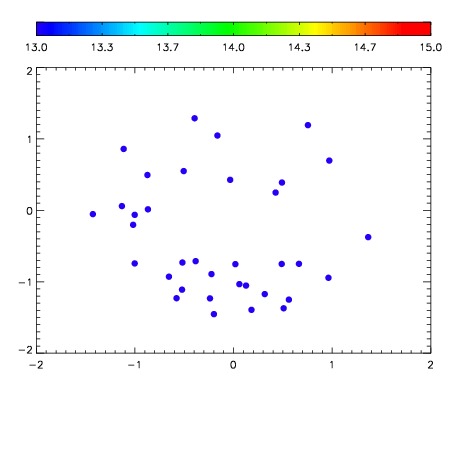

| Frame | Nreads | Zeropoints | Mag plots | Spatial mag deviation | Spatial sky 16325A emission deviations (filled: sky, open: star) | Spatial sky continuum emission | Spatial sky telluric CO2 absorption deviations (filled: H < 10) | |||||||||||||||||||||||
| 0 | 0 |
|
|
|
|
|
|
| IPAIR | NAME | SHIFT | NEWSHIFT | S/N | NAME | SHIFT | NEWSHIFT | S/N |
| 0 | 11130087 | 0.482459 | 0.00000 | 235.482 | 11130085 | -0.00434359 | 0.486803 | 234.079 |
| 1 | 11130091 | 0.481687 | 0.000771999 | 240.819 | 11130089 | -0.00335911 | 0.485818 | 237.631 |
| 2 | 11130090 | 0.479790 | 0.00266901 | 240.671 | 11130092 | -0.00246746 | 0.484926 | 234.232 |
| 3 | 11130086 | 0.480912 | 0.00154701 | 233.666 | 11130084 | -0.00386313 | 0.486322 | 233.098 |
| 4 | 11130083 | 0.481217 | 0.00124201 | 228.599 | 11130088 | -0.00269442 | 0.485153 | 232.265 |
| 5 | 11130082 | 0.480030 | 0.00242901 | 227.744 | 11130081 | 0.00000 | 0.482459 | 228.935 |