| Red | Green | Blue | |
| z | 17.64 | ||
| znorm | Inf | ||
| sky | -Inf | -Inf | -Inf |
| S/N | 19.6 | 35.4 | 39.2 |
| S/N(c) | 0.0 | 0.0 | 0.0 |
| SN(E/C) |

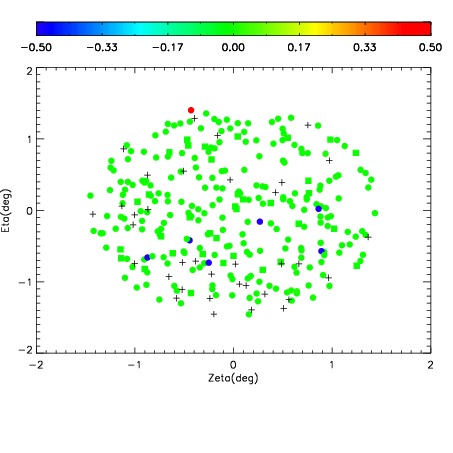
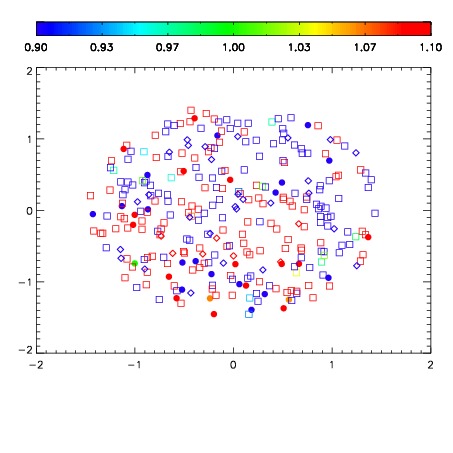
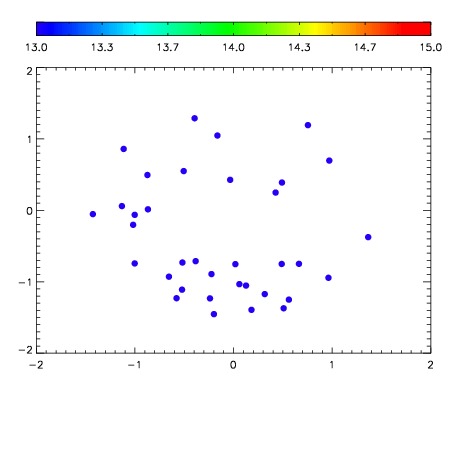

| Frame | Nreads | Zeropoints | Mag plots | Spatial mag deviation | Spatial sky 16325A emission deviations (filled: sky, open: star) | Spatial sky continuum emission | Spatial sky telluric CO2 absorption deviations (filled: H < 10) | |||||||||||||||||||||||
| 0 | 0 |
|
|
|
|
|
|
| IPAIR | NAME | SHIFT | NEWSHIFT | S/N | NAME | SHIFT | NEWSHIFT | S/N |
| 0 | 11360065 | 0.481154 | 0.00000 | 166.318 | 11360066 | -0.000508396 | 0.481662 | 136.499 |
| 1 | 11360061 | 0.480759 | 0.000395000 | 218.870 | 11360059 | 0.00000 | 0.481154 | 223.795 |
| 2 | 11360064 | 0.480130 | 0.00102401 | 214.227 | 11360063 | -0.000835092 | 0.481989 | 221.414 |
| 3 | 11360060 | 0.479885 | 0.00126898 | 204.696 | 11360062 | -0.000611373 | 0.481765 | 194.568 |
| 4 | 11360068 | 0.480024 | 0.00112998 | 144.671 | 11360067 | -0.000835264 | 0.481989 | 130.687 |
| 5 | 11360069 | 0.480872 | 0.000281990 | 133.949 | 11360070 | -0.000885489 | 0.482039 | 123.625 |