| Red | Green | Blue | |
| z | 17.64 | ||
| znorm | Inf | ||
| sky | -Inf | -Inf | -Inf |
| S/N | 26.0 | 42.8 | 48.6 |
| S/N(c) | 0.0 | 0.0 | 0.0 |
| SN(E/C) |
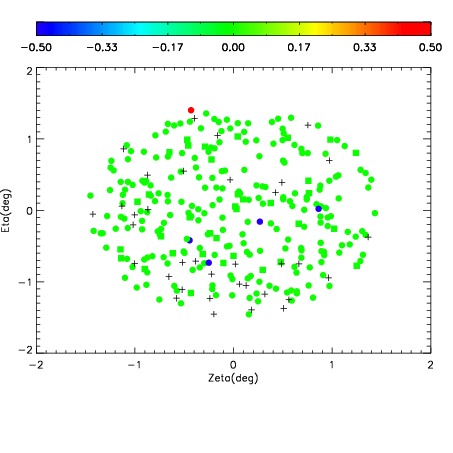
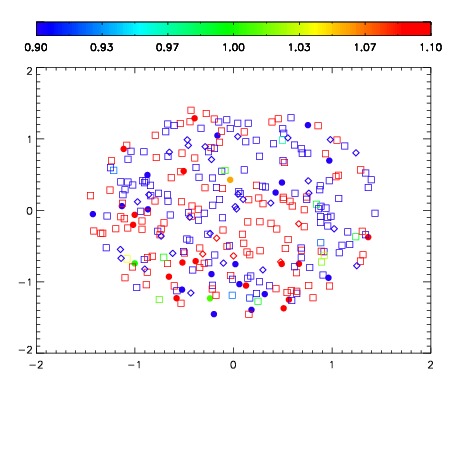
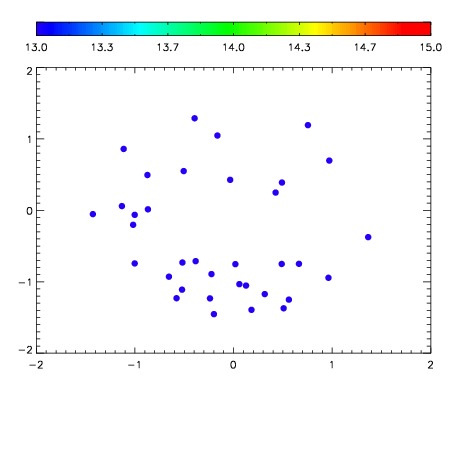

| Frame | Nreads | Zeropoints | Mag plots | Spatial mag deviation | Spatial sky 16325A emission deviations (filled: sky, open: star) | Spatial sky continuum emission | Spatial sky telluric CO2 absorption deviations (filled: H < 10) | |||||||||||||||||||||||
| 0 | 0 |
|
|
|
|
|
|
| IPAIR | NAME | SHIFT | NEWSHIFT | S/N | NAME | SHIFT | NEWSHIFT | S/N |
| 0 | 11380065 | 0.474014 | 0.00000 | 242.934 | 11380066 | 0.000305584 | 0.473708 | 242.131 |
| 1 | 11380064 | 0.473612 | 0.000402004 | 246.327 | 11380063 | -0.00194280 | 0.475957 | 247.560 |
| 2 | 11380060 | 0.472808 | 0.00120601 | 245.084 | 11380062 | -0.00215812 | 0.476172 | 244.930 |
| 3 | 11380061 | 0.473154 | 0.000860006 | 239.546 | 11380059 | 0.00000 | 0.474014 | 240.036 |