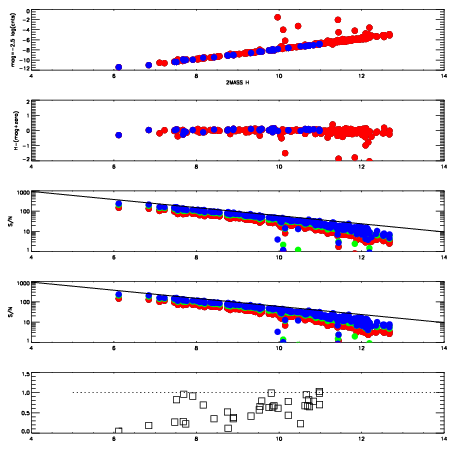
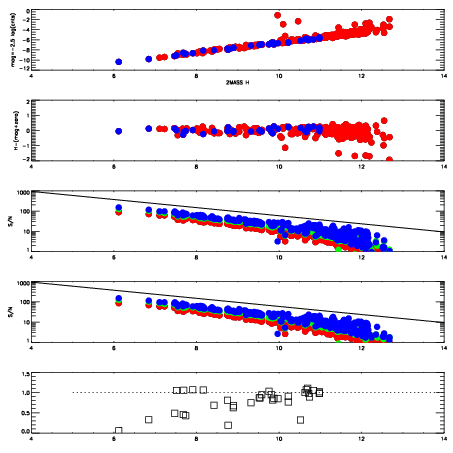
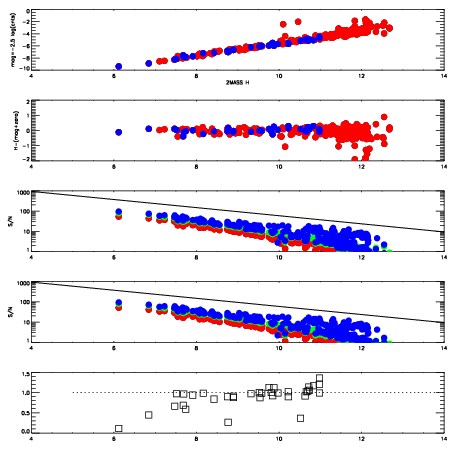
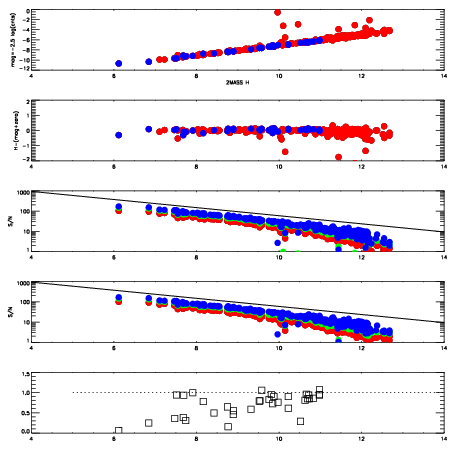
| Frame | Nreads | Zeropoints | Mag plots
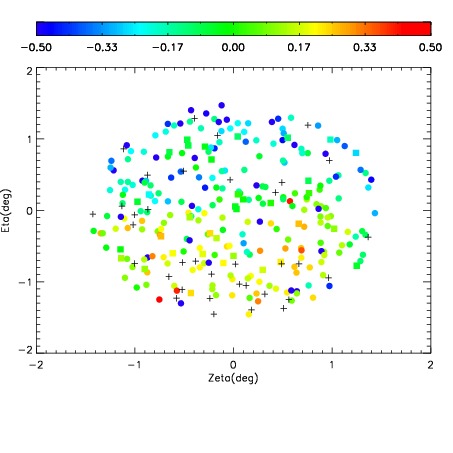
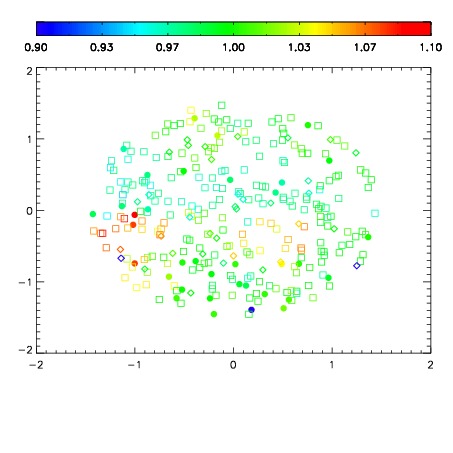
| Spatial mag deviation
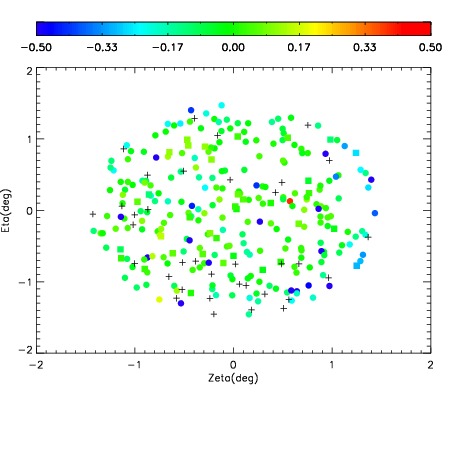
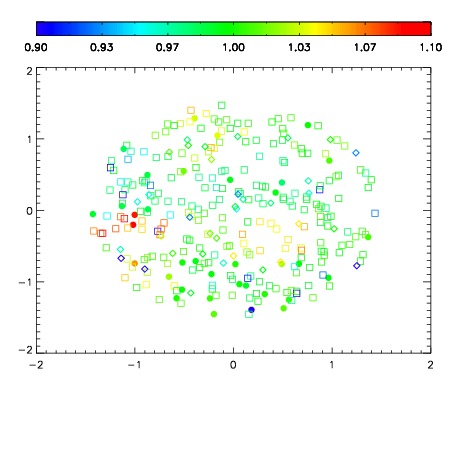
| Spatial sky 16325A emission deviations (filled: sky, open: star)
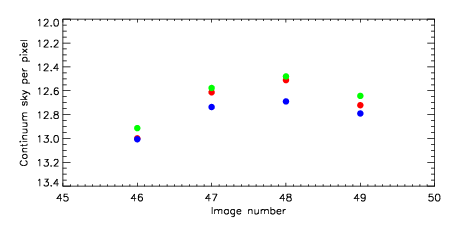
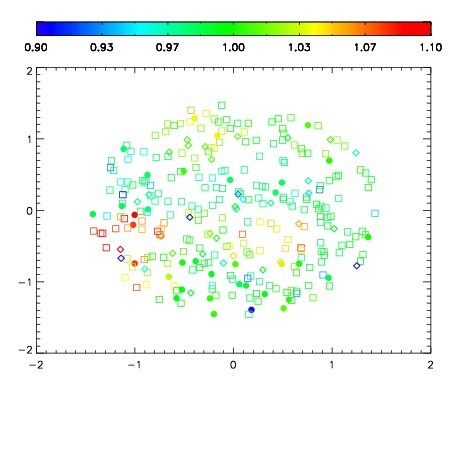
| Spatial sky continuum emission
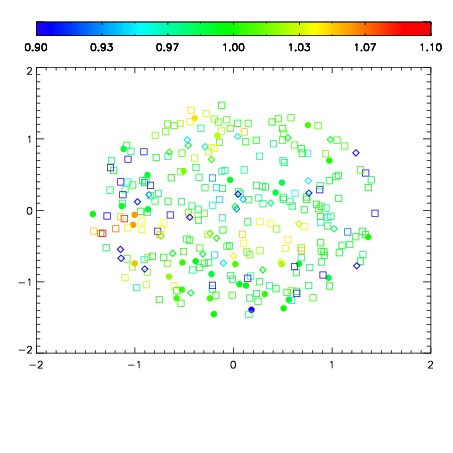
| Spatial sky telluric CO2 absorption deviations (filled: H < 10)
|
| 11420046
| 47
| | Red | Green | Blue
| | z | | 17.81
| | znorm | | 13.63
| | sky | 13.0 | 12.9 | 13.0
| | S/N | 5.4 | 8.8 | 10.5
| | S/N(c) | 4.9 | 8.6 | 10.1
| | SN(E/C) 0.65
|
| 
| 
| 
| 
| 
|
| 11420047
| 47
| | Red | Green | Blue
| | z | | 16.52
| | znorm | | 12.34
| | sky | 12.6 | 12.6 | 12.7
| | S/N | 1.5 | 2.6 | 3.2
| | S/N(c) | 1.5 | 2.5 | 3.2
| | SN(E/C) 0.87
|
| 
| 
| 
| 
| 
|
| 11420048
| 47
| | Red | Green | Blue
| | z | | 15.61
| | znorm | | 11.43
| | sky | 12.5 | 12.5 | 12.7
| | S/N | 0.7 | 1.1 | 1.5
| | S/N(c) | 0.6 | 1.0 | 1.6
| | SN(E/C) 0.97
|
| 
| 
| 
| 
| 
|
| 11420049
| 47
| | Red | Green | Blue
| | z | | 17.08
| | znorm | | 12.90
| | sky | 12.7 | 12.6 | 12.8
| | S/N | 2.6 | 4.5 | 5.1
| | S/N(c) | 2.5 | 4.2 | 5.3
| | SN(E/C) 0.80
|
| 
| 
| 
| 
| 
|