| Red | Green | Blue | |
| z | 17.64 | ||
| znorm | Inf | ||
| sky | -NaN | -Inf | -Inf |
| S/N | 25.3 | 45.9 | 52.2 |
| S/N(c) | 0.0 | 0.0 | 0.0 |
| SN(E/C) |
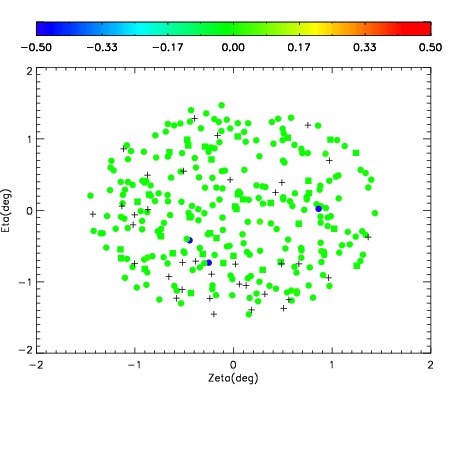
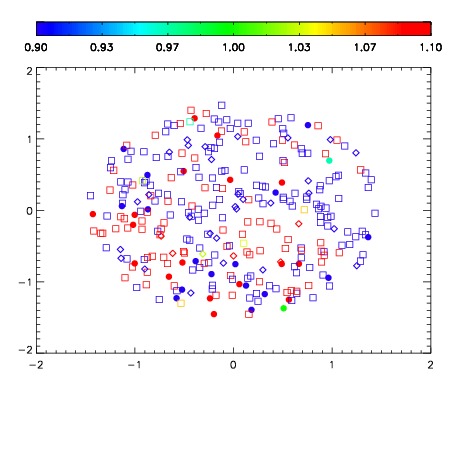
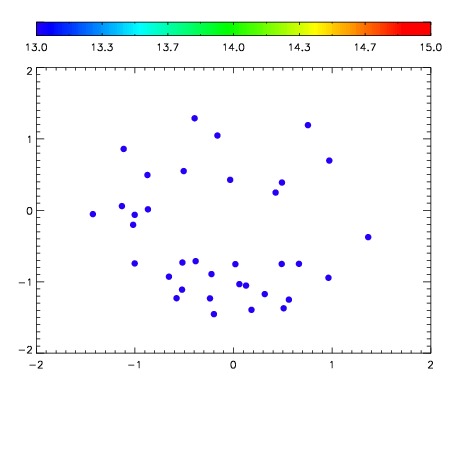

| Frame | Nreads | Zeropoints | Mag plots | Spatial mag deviation | Spatial sky 16325A emission deviations (filled: sky, open: star) | Spatial sky continuum emission | Spatial sky telluric CO2 absorption deviations (filled: H < 10) | |||||||||||||||||||||||
| 0 | 0 |
|
|
|
|
|
|
| IPAIR | NAME | SHIFT | NEWSHIFT | S/N | NAME | SHIFT | NEWSHIFT | S/N |
| 0 | 11670057 | 0.493360 | 0.00000 | 182.647 | 11670051 | -0.00242757 | 0.495788 | 157.696 |
| 1 | 11670048 | 0.491533 | 0.00182700 | 248.146 | 11670047 | 0.00000 | 0.493360 | 240.411 |
| 2 | 11670049 | 0.491987 | 0.00137302 | 227.375 | 11670055 | -0.00402538 | 0.497385 | 239.827 |
| 3 | 11670053 | 0.492508 | 0.000852019 | 215.666 | 11670054 | -0.00316319 | 0.496523 | 218.724 |
| 4 | 11670056 | 0.492256 | 0.00110403 | 209.066 | 11670058 | -0.00254160 | 0.495902 | 190.926 |
| 5 | 11670052 | 0.491191 | 0.00216901 | 201.754 | 11670050 | -0.00374413 | 0.497104 | 188.906 |