| Red | Green | Blue | |
| z | 17.64 | ||
| znorm | Inf | ||
| sky | -Inf | -Inf | -Inf |
| S/N | 22.5 | 40.5 | 43.1 |
| S/N(c) | 0.0 | 0.0 | 0.0 |
| SN(E/C) |
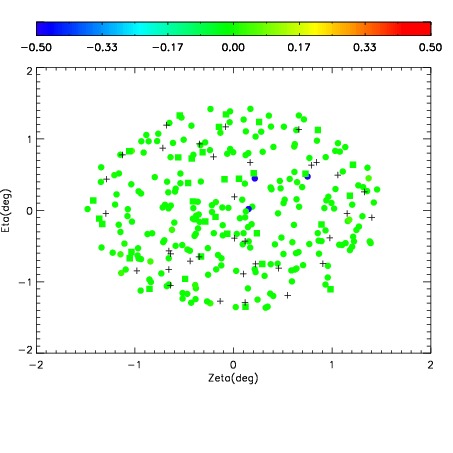
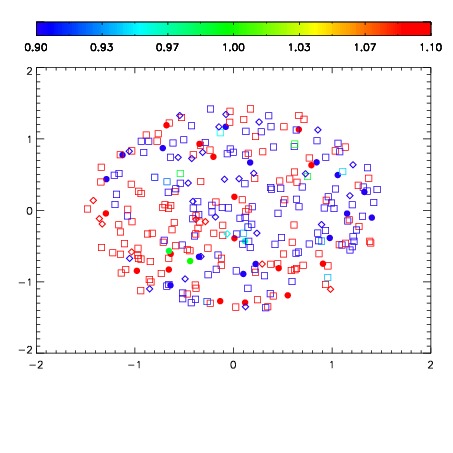
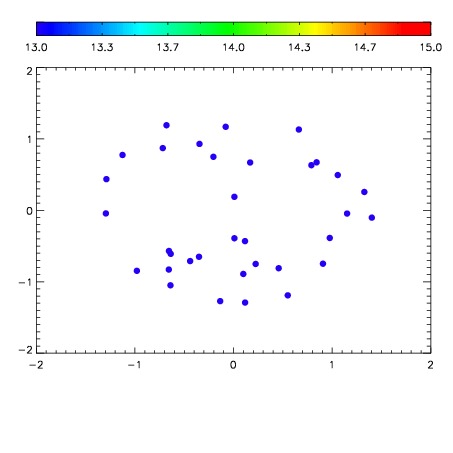

| Frame | Nreads | Zeropoints | Mag plots | Spatial mag deviation | Spatial sky 16325A emission deviations (filled: sky, open: star) | Spatial sky continuum emission | Spatial sky telluric CO2 absorption deviations (filled: H < 10) | |||||||||||||||||||||||
| 0 | 0 |
|
|
|
|
|
|
| IPAIR | NAME | SHIFT | NEWSHIFT | S/N | NAME | SHIFT | NEWSHIFT | S/N |
| 0 | 11400053 | 0.474621 | 0.00000 | 207.708 | 11400059 | 0.000469789 | 0.474151 | 211.105 |
| 1 | 11400058 | 0.474586 | 3.49879e-05 | 207.162 | 11400052 | 0.00000 | 0.474621 | 202.914 |
| 2 | 11400054 | 0.474444 | 0.000176996 | 203.592 | 11400056 | -0.00185434 | 0.476475 | 197.762 |
| 3 | 11400057 | 0.474262 | 0.000358999 | 200.456 | 11400055 | -0.00111066 | 0.475732 | 197.582 |