| Red | Green | Blue | |
| z | 17.64 | ||
| znorm | Inf | ||
| sky | -Inf | -Inf | -Inf |
| S/N | 29.4 | 48.9 | 51.9 |
| S/N(c) | 0.0 | 0.0 | 0.0 |
| SN(E/C) |
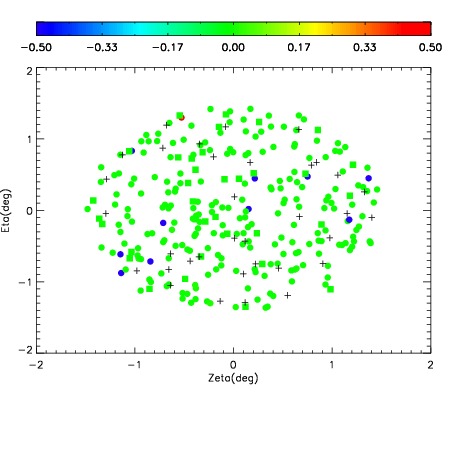
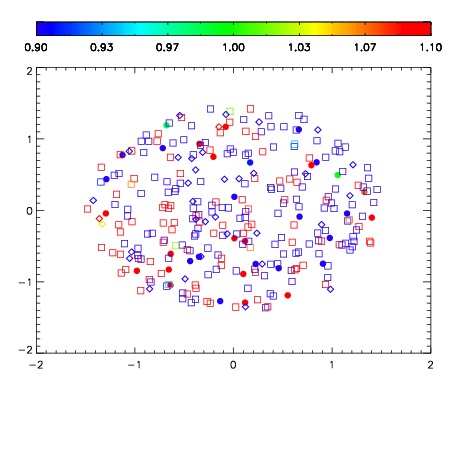
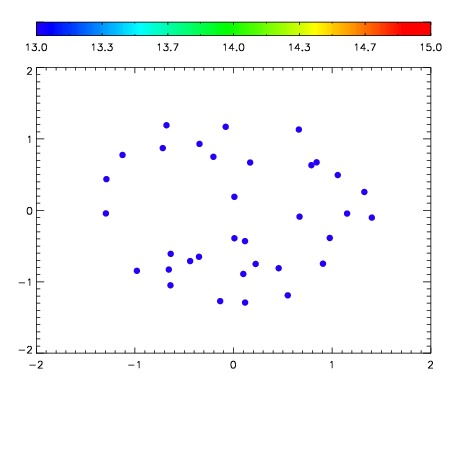

| Frame | Nreads | Zeropoints | Mag plots | Spatial mag deviation | Spatial sky 16325A emission deviations (filled: sky, open: star) | Spatial sky continuum emission | Spatial sky telluric CO2 absorption deviations (filled: H < 10) | |||||||||||||||||||||||
| 0 | 0 |
|
|
|
|
|
|
| IPAIR | NAME | SHIFT | NEWSHIFT | S/N | NAME | SHIFT | NEWSHIFT | S/N |
| 0 | 11470016 | 0.477242 | 0.00000 | 210.721 | 11470015 | -0.00322069 | 0.480463 | 210.459 |
| 1 | 11470017 | 0.476114 | 0.00112799 | 213.762 | 11470018 | -0.00316179 | 0.480404 | 215.633 |
| 2 | 11470013 | 0.476017 | 0.00122499 | 207.084 | 11470014 | -0.00297437 | 0.480216 | 207.177 |
| 3 | 11470012 | 0.476308 | 0.000934005 | 203.425 | 11470011 | 0.00000 | 0.477242 | 200.734 |