| Red | Green | Blue | |
| z | 17.64 | ||
| znorm | Inf | ||
| sky | -Inf | -Inf | -Inf |
| S/N | 18.9 | 34.4 | 38.1 |
| S/N(c) | 0.0 | 0.0 | 0.0 |
| SN(E/C) |

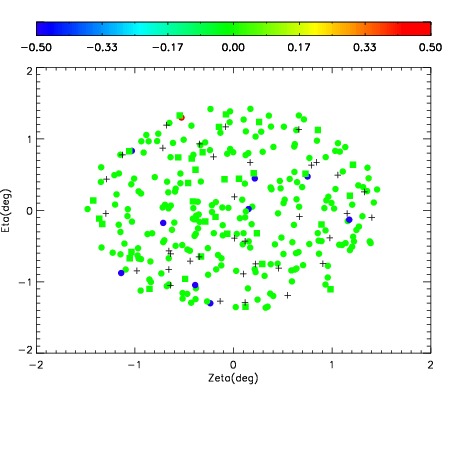
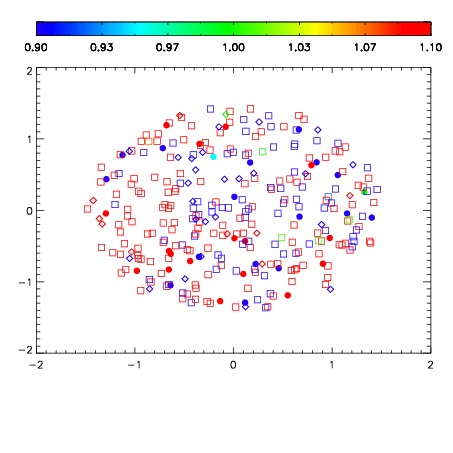

| Frame | Nreads | Zeropoints | Mag plots | Spatial mag deviation | Spatial sky 16325A emission deviations (filled: sky, open: star) | Spatial sky continuum emission | Spatial sky telluric CO2 absorption deviations (filled: H < 10) | |||||||||||||||||||||||
| 0 | 0 |
|
|
|
|
|
|
| IPAIR | NAME | SHIFT | NEWSHIFT | S/N | NAME | SHIFT | NEWSHIFT | S/N |
| 0 | 11730035 | 0.492273 | 0.00000 | 167.086 | 11730037 | -0.000655658 | 0.492929 | 168.752 |
| 1 | 11730038 | 0.491712 | 0.000560999 | 171.665 | 11730040 | -0.00194835 | 0.494221 | 173.760 |
| 2 | 11730039 | 0.492108 | 0.000165015 | 163.815 | 11730033 | 0.00000 | 0.492273 | 160.418 |
| 3 | 11730034 | 0.492210 | 6.30021e-05 | 152.818 | 11730036 | -0.000288283 | 0.492561 | 159.369 |