| Red | Green | Blue | |
| z | 17.64 | ||
| znorm | Inf | ||
| sky | -Inf | -Inf | -Inf |
| S/N | 21.8 | 38.6 | 42.2 |
| S/N(c) | 0.0 | 0.0 | 0.0 |
| SN(E/C) |
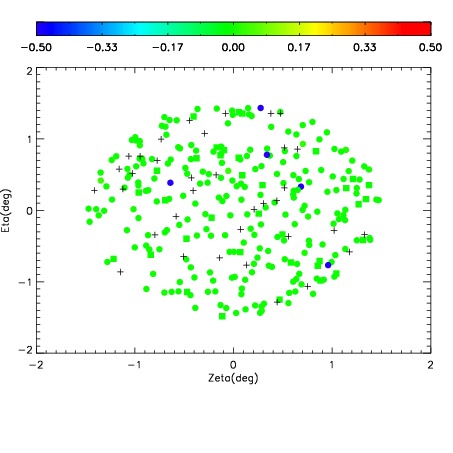
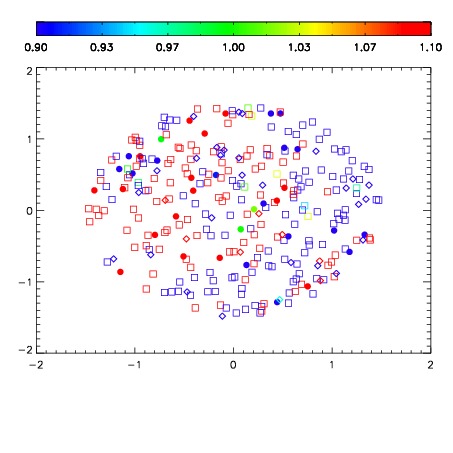
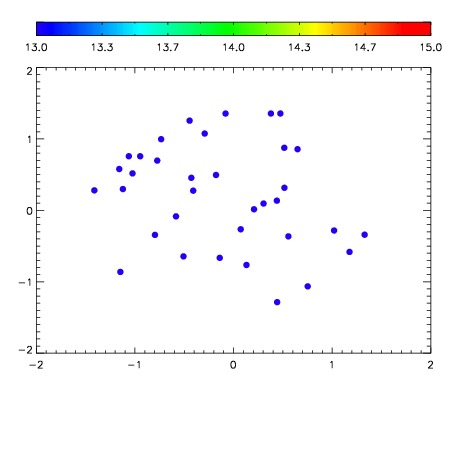

| Frame | Nreads | Zeropoints | Mag plots | Spatial mag deviation | Spatial sky 16325A emission deviations (filled: sky, open: star) | Spatial sky continuum emission | Spatial sky telluric CO2 absorption deviations (filled: H < 10) | |||||||||||||||||||||||
| 0 | 0 |
|
|
|
|
|
|
| IPAIR | NAME | SHIFT | NEWSHIFT | S/N | NAME | SHIFT | NEWSHIFT | S/N |
| 0 | 11160048 | 0.478492 | 0.00000 | 169.191 | 11160046 | 0.00000 | 0.478492 | 170.288 |
| 1 | 11160047 | 0.477269 | 0.00122300 | 176.617 | 11160049 | -0.00255521 | 0.481047 | 176.955 |
| 2 | 11160051 | 0.478098 | 0.000393987 | 171.427 | 11160050 | -0.00188403 | 0.480376 | 175.609 |
| 3 | 11160052 | 0.478383 | 0.000108987 | 167.389 | 11160053 | 0.00197035 | 0.476522 | 166.563 |