| Red | Green | Blue | |
| z | 17.64 | ||
| znorm | Inf | ||
| sky | -Inf | -Inf | -Inf |
| S/N | 17.4 | 31.7 | 34.4 |
| S/N(c) | 0.0 | 0.0 | 0.0 |
| SN(E/C) |
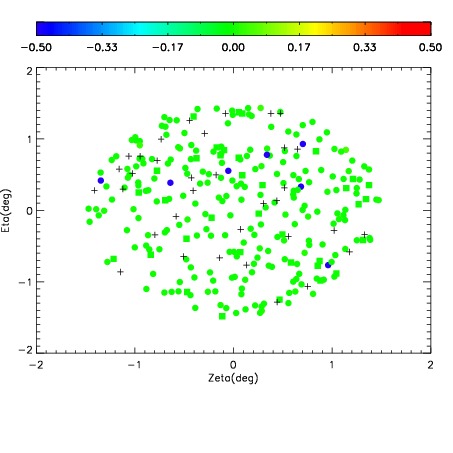
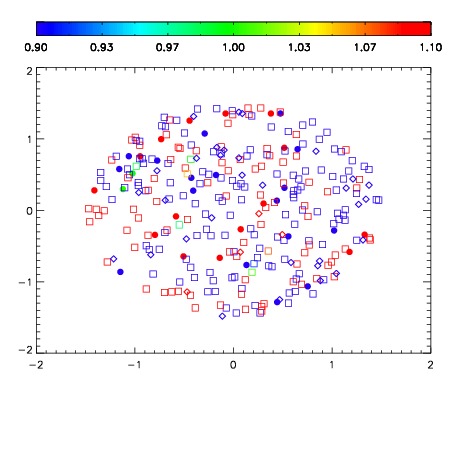
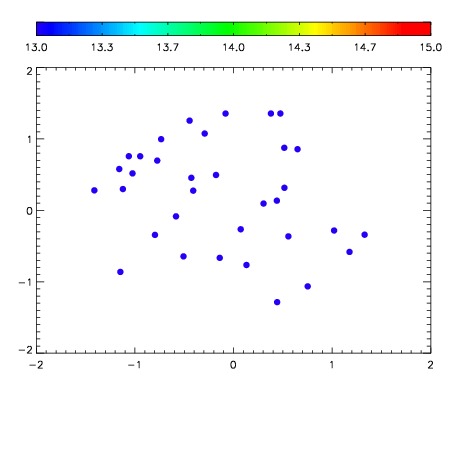

| Frame | Nreads | Zeropoints | Mag plots | Spatial mag deviation | Spatial sky 16325A emission deviations (filled: sky, open: star) | Spatial sky continuum emission | Spatial sky telluric CO2 absorption deviations (filled: H < 10) | |||||||||||||||||||||||
| 0 | 0 |
|
|
|
|
|
|
| IPAIR | NAME | SHIFT | NEWSHIFT | S/N | NAME | SHIFT | NEWSHIFT | S/N |
| 0 | 11340059 | 0.482939 | 0.00000 | 100.826 | 11340054 | 0.00000 | 0.482939 | 96.7843 |
| 1 | 11340056 | 0.480500 | 0.00243899 | 181.346 | 11340057 | -0.00175007 | 0.484689 | 161.309 |
| 2 | 11340060 | 0.482272 | 0.000667006 | 177.851 | 11340061 | -0.000250819 | 0.483190 | 146.400 |
| 3 | 11340055 | 0.480370 | 0.00256902 | 167.948 | 11340058 | -0.00111492 | 0.484054 | 114.845 |