| Red | Green | Blue | |
| z | 17.64 | ||
| znorm | Inf | ||
| sky | -Inf | -Inf | -Inf |
| S/N | 28.8 | 51.4 | 56.1 |
| S/N(c) | 0.0 | 0.0 | 0.0 |
| SN(E/C) |
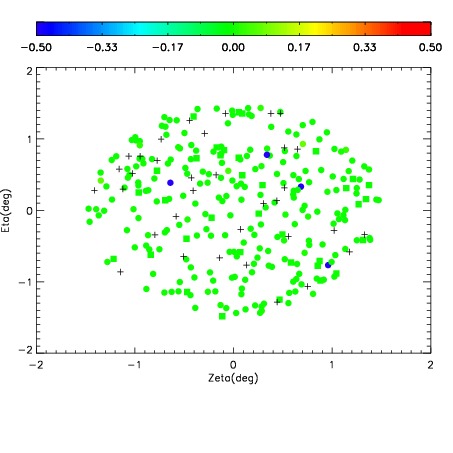
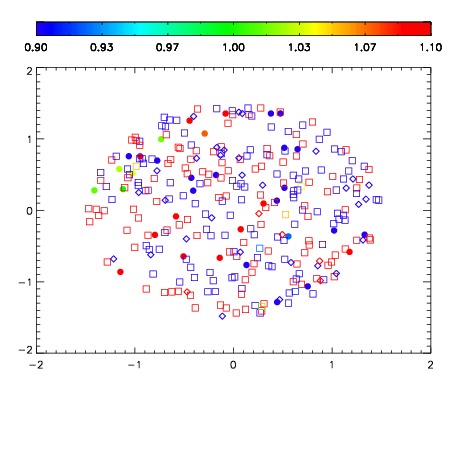
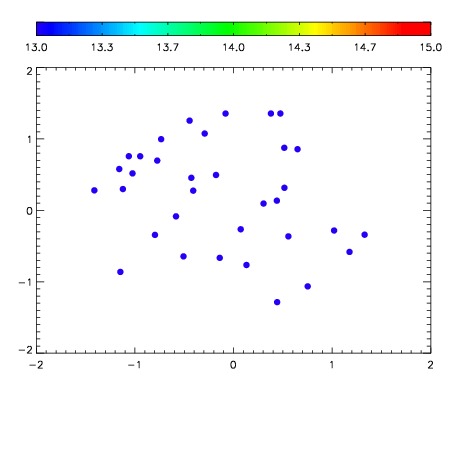

| Frame | Nreads | Zeropoints | Mag plots | Spatial mag deviation | Spatial sky 16325A emission deviations (filled: sky, open: star) | Spatial sky continuum emission | Spatial sky telluric CO2 absorption deviations (filled: H < 10) | |||||||||||||||||||||||
| 0 | 0 |
|
|
|
|
|
|
| IPAIR | NAME | SHIFT | NEWSHIFT | S/N | NAME | SHIFT | NEWSHIFT | S/N |
| 0 | 11350064 | 0.478588 | 0.00000 | 172.708 | 11350065 | -0.00178373 | 0.480372 | 160.126 |
| 1 | 11350055 | 0.476758 | 0.00183001 | 192.711 | 11350054 | 0.00000 | 0.478588 | 189.230 |
| 2 | 11350056 | 0.477879 | 0.000709027 | 191.528 | 11350057 | -0.00224300 | 0.480831 | 181.471 |
| 3 | 11350059 | 0.476799 | 0.00178900 | 180.990 | 11350061 | -0.00143072 | 0.480019 | 179.773 |
| 4 | 11350060 | 0.477729 | 0.000859022 | 178.015 | 11350058 | -0.00231740 | 0.480905 | 175.429 |
| 5 | 11350063 | 0.478248 | 0.000340015 | 177.988 | 11350062 | -0.00164740 | 0.480235 | 172.776 |