| Red | Green | Blue | |
| z | 17.64 | ||
| znorm | Inf | ||
| sky | -Inf | -Inf | -Inf |
| S/N | 29.2 | 50.8 | 57.6 |
| S/N(c) | 0.0 | 0.0 | 0.0 |
| SN(E/C) |
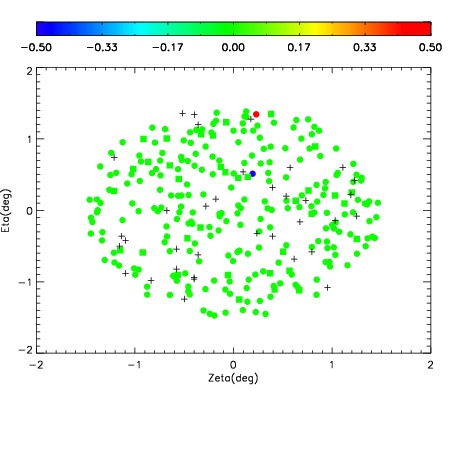
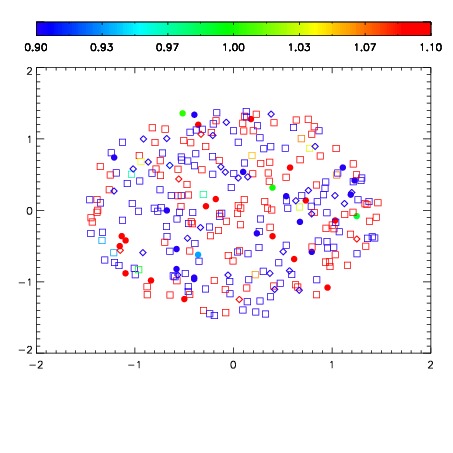
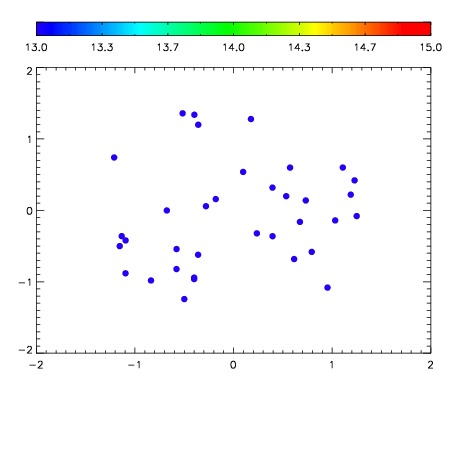

| Frame | Nreads | Zeropoints | Mag plots | Spatial mag deviation | Spatial sky 16325A emission deviations (filled: sky, open: star) | Spatial sky continuum emission | Spatial sky telluric CO2 absorption deviations (filled: H < 10) | |||||||||||||||||||||||
| 0 | 0 |
|
|
|
|
|
|
| IPAIR | NAME | SHIFT | NEWSHIFT | S/N | NAME | SHIFT | NEWSHIFT | S/N |
| 0 | 11120091 | 0.479729 | 0.00000 | 214.329 | 11120092 | 0.000595312 | 0.479134 | 221.306 |
| 1 | 11120087 | 0.477968 | 0.00176099 | 209.529 | 11120085 | 0.000907548 | 0.478821 | 203.782 |
| 2 | 11120090 | 0.479644 | 8.49962e-05 | 207.292 | 11120089 | -0.00168904 | 0.481418 | 199.023 |
| 3 | 11120086 | 0.477658 | 0.00207099 | 207.220 | 11120084 | -0.00108850 | 0.480817 | 197.107 |
| 4 | 11120083 | 0.476728 | 0.00300100 | 201.624 | 11120081 | 0.00000 | 0.479729 | 192.434 |
| 5 | 11120082 | 0.475379 | 0.00435001 | 198.969 | 11120088 | -0.00215207 | 0.481881 | 184.611 |