| Red | Green | Blue | |
| z | 17.64 | ||
| znorm | Inf | ||
| sky | -NaN | -Inf | -Inf |
| S/N | 25.3 | 45.2 | 47.9 |
| S/N(c) | 0.0 | 0.0 | 0.0 |
| SN(E/C) |
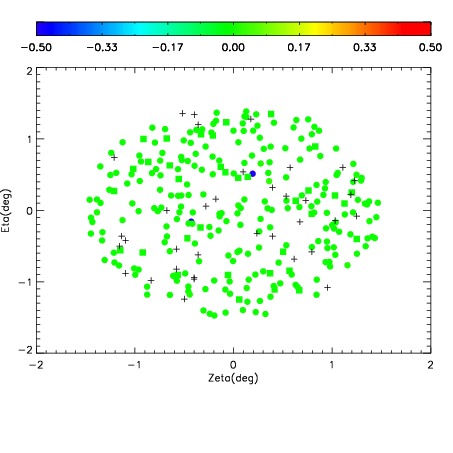
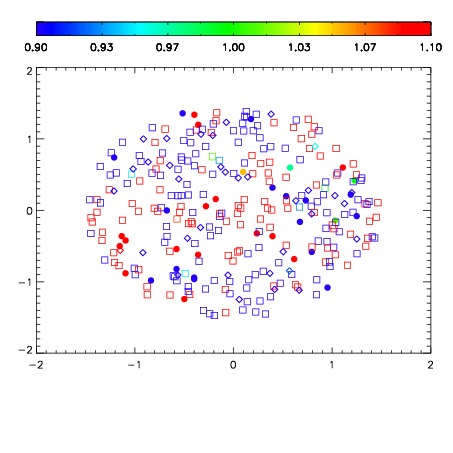


| Frame | Nreads | Zeropoints | Mag plots | Spatial mag deviation | Spatial sky 16325A emission deviations (filled: sky, open: star) | Spatial sky continuum emission | Spatial sky telluric CO2 absorption deviations (filled: H < 10) | |||||||||||||||||||||||
| 0 | 0 |
|
|
|
|
|
|
| IPAIR | NAME | SHIFT | NEWSHIFT | S/N | NAME | SHIFT | NEWSHIFT | S/N |
| 0 | 11440048 | 0.478616 | 0.00000 | 234.430 | 11440046 | -0.00339157 | 0.482008 | 238.218 |
| 1 | 11440047 | 0.477943 | 0.000672996 | 232.586 | 11440049 | -0.00360074 | 0.482217 | 235.534 |
| 2 | 11440044 | 0.476618 | 0.00199801 | 226.134 | 11440045 | -0.00290123 | 0.481517 | 233.189 |
| 3 | 11440043 | 0.476321 | 0.00229499 | 224.059 | 11440042 | 0.00000 | 0.478616 | 221.060 |