| Red | Green | Blue | |
| z | 17.64 | ||
| znorm | Inf | ||
| sky | -Inf | -Inf | -Inf |
| S/N | 22.9 | 41.2 | 45.0 |
| S/N(c) | 0.0 | 0.0 | 0.0 |
| SN(E/C) |

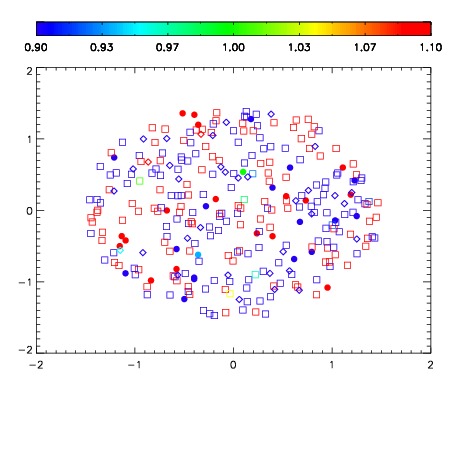
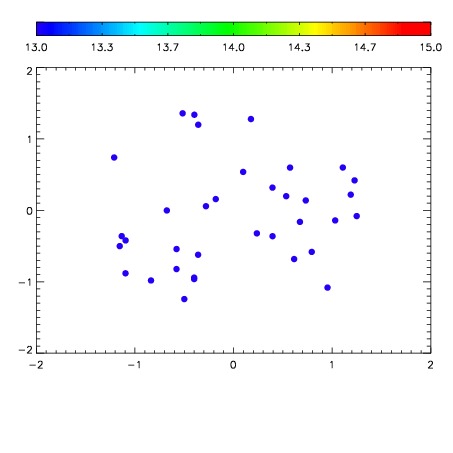

| Frame | Nreads | Zeropoints | Mag plots | Spatial mag deviation | Spatial sky 16325A emission deviations (filled: sky, open: star) | Spatial sky continuum emission | Spatial sky telluric CO2 absorption deviations (filled: H < 10) | |||||||||||||||||||||||
| 0 | 0 |
|
|
|
|
|
|
| IPAIR | NAME | SHIFT | NEWSHIFT | S/N | NAME | SHIFT | NEWSHIFT | S/N |
| 0 | 11640055 | 0.491719 | 0.00000 | 199.647 | 11640057 | -0.00130181 | 0.493021 | 197.858 |
| 1 | 11640056 | 0.491513 | 0.000205994 | 189.555 | 11640054 | -0.000943995 | 0.492663 | 195.565 |
| 2 | 11640052 | 0.491331 | 0.000387996 | 189.536 | 11640053 | -0.00139462 | 0.493114 | 188.748 |
| 3 | 11640051 | 0.491247 | 0.000472009 | 186.351 | 11640050 | 0.00000 | 0.491719 | 176.354 |