| Red | Green | Blue | |
| z | 17.64 | ||
| znorm | Inf | ||
| sky | -Inf | -Inf | -Inf |
| S/N | 34.7 | 55.9 | 64.4 |
| S/N(c) | 0.0 | 0.0 | 0.0 |
| SN(E/C) |
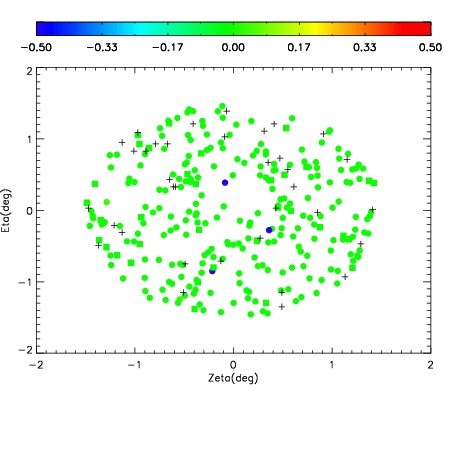
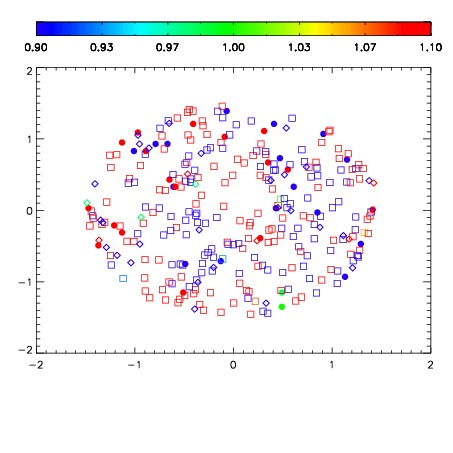


| Frame | Nreads | Zeropoints | Mag plots | Spatial mag deviation | Spatial sky 16325A emission deviations (filled: sky, open: star) | Spatial sky continuum emission | Spatial sky telluric CO2 absorption deviations (filled: H < 10) | |||||||||||||||||||||||
| 0 | 0 |
|
|
|
|
|
|
| IPAIR | NAME | SHIFT | NEWSHIFT | S/N | NAME | SHIFT | NEWSHIFT | S/N |
| 0 | 11140093 | 0.489465 | 0.00000 | 195.130 | 11140091 | 0.00227241 | 0.487193 | 180.164 |
| 1 | 11140092 | 0.488029 | 0.00143600 | 214.639 | 11140094 | 0.00192499 | 0.487540 | 188.746 |
| 2 | 11140088 | 0.488416 | 0.00104901 | 189.111 | 11140090 | 0.00123701 | 0.488228 | 178.736 |
| 3 | 11140089 | 0.488425 | 0.00104001 | 185.127 | 11140087 | 0.00244986 | 0.487015 | 164.158 |
| 4 | 11140085 | 0.485354 | 0.00411099 | 142.590 | 11140086 | 0.000645150 | 0.488820 | 151.835 |
| 5 | 11140084 | 0.484821 | 0.00464401 | 138.341 | 11140083 | 0.00000 | 0.489465 | 139.162 |