| Red | Green | Blue | |
| z | 17.64 | ||
| znorm | Inf | ||
| sky | -Inf | -Inf | -Inf |
| S/N | 24.6 | 40.9 | 47.0 |
| S/N(c) | 0.0 | 0.0 | 0.0 |
| SN(E/C) |
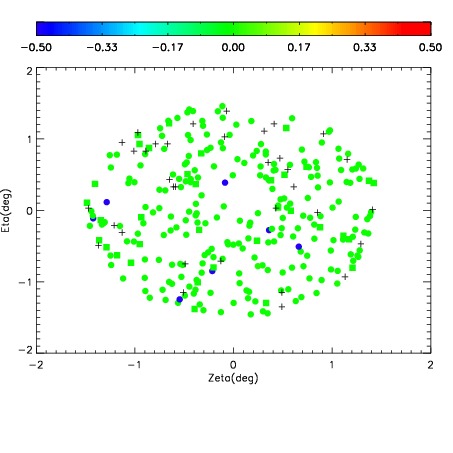
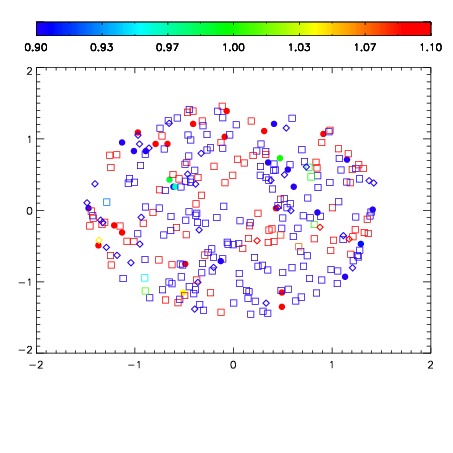


| Frame | Nreads | Zeropoints | Mag plots | Spatial mag deviation | Spatial sky 16325A emission deviations (filled: sky, open: star) | Spatial sky continuum emission | Spatial sky telluric CO2 absorption deviations (filled: H < 10) | |||||||||||||||||||||||
| 0 | 0 |
|
|
|
|
|
|
| IPAIR | NAME | SHIFT | NEWSHIFT | S/N | NAME | SHIFT | NEWSHIFT | S/N |
| 0 | 11650045 | 0.496500 | 0.00000 | 150.410 | 11650046 | -0.00111428 | 0.497614 | 168.878 |
| 1 | 11650049 | 0.495563 | 0.000936985 | 179.355 | 11650050 | -0.000747376 | 0.497247 | 184.083 |
| 2 | 11650048 | 0.495386 | 0.00111398 | 175.068 | 11650047 | 6.36984e-05 | 0.496436 | 171.518 |
| 3 | 11650044 | 0.496409 | 9.09865e-05 | 138.737 | 11650043 | 0.00000 | 0.496500 | 40.2972 |