| Red | Green | Blue | |
| z | 17.64 | ||
| znorm | Inf | ||
| sky | -Inf | -Inf | -Inf |
| S/N | 22.2 | 41.3 | 47.9 |
| S/N(c) | 0.0 | 0.0 | 0.0 |
| SN(E/C) |
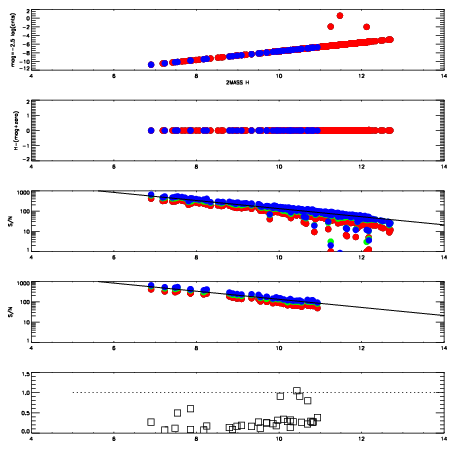
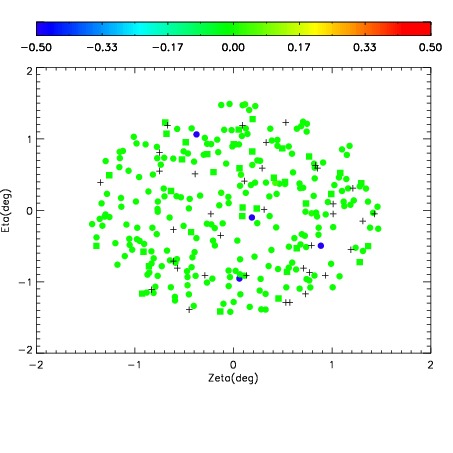
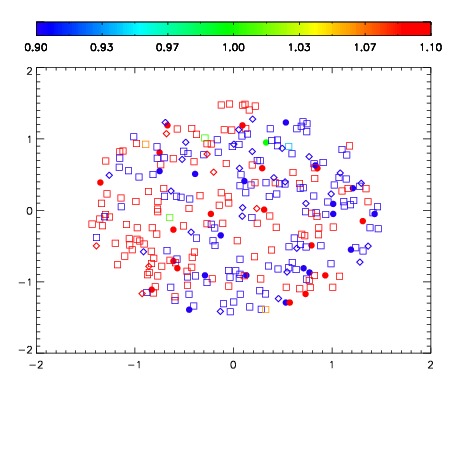
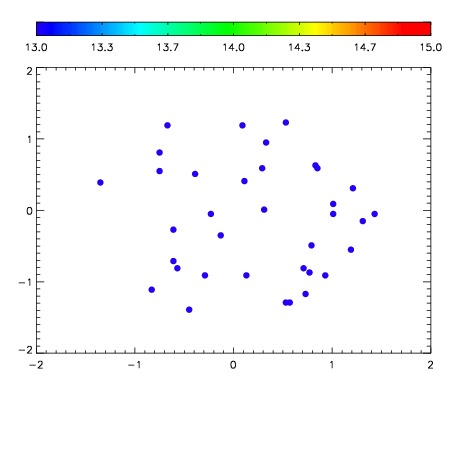

| Frame | Nreads | Zeropoints | Mag plots | Spatial mag deviation | Spatial sky 16325A emission deviations (filled: sky, open: star) | Spatial sky continuum emission | Spatial sky telluric CO2 absorption deviations (filled: H < 10) | |||||||||||||||||||||||
| 0 | 0 |
|
|
|
|
|
|
| IPAIR | NAME | SHIFT | NEWSHIFT | S/N | NAME | SHIFT | NEWSHIFT | S/N |
| 0 | 11150085 | 0.483676 | 0.00000 | 191.031 | 11150084 | 0.000869811 | 0.482806 | 198.657 |
| 1 | 11150077 | 0.481736 | 0.00193998 | 218.092 | 11150076 | 0.00000 | 0.483676 | 225.436 |
| 2 | 11150078 | 0.482621 | 0.00105497 | 216.821 | 11150079 | -0.000623679 | 0.484300 | 221.411 |
| 3 | 11150081 | 0.480854 | 0.00282198 | 205.353 | 11150080 | -0.000808172 | 0.484484 | 215.286 |
| 4 | 11150082 | 0.481878 | 0.00179797 | 204.556 | 11150083 | 0.000644506 | 0.483031 | 205.173 |