| Red | Green | Blue | |
| z | 17.64 | ||
| znorm | Inf | ||
| sky | -Inf | -Inf | -Inf |
| S/N | 23.3 | 40.8 | 44.8 |
| S/N(c) | 0.0 | 0.0 | 0.0 |
| SN(E/C) |
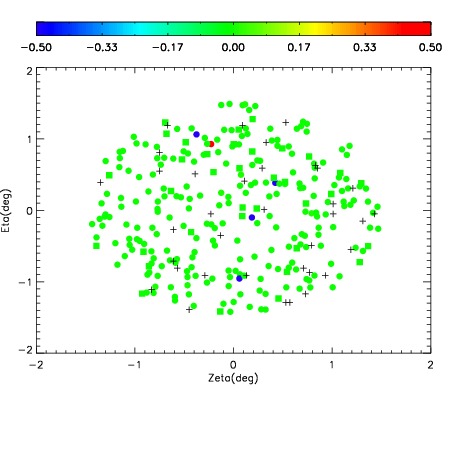
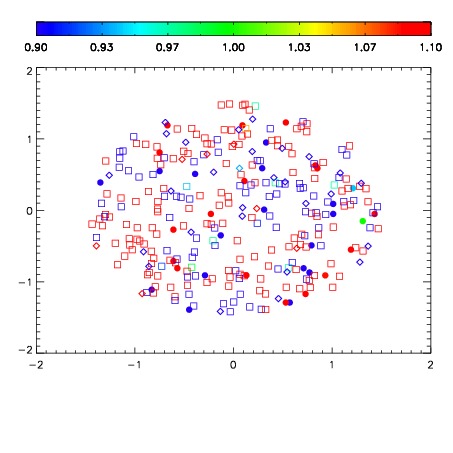


| Frame | Nreads | Zeropoints | Mag plots | Spatial mag deviation | Spatial sky 16325A emission deviations (filled: sky, open: star) | Spatial sky continuum emission | Spatial sky telluric CO2 absorption deviations (filled: H < 10) | |||||||||||||||||||||||
| 0 | 0 |
|
|
|
|
|
|
| IPAIR | NAME | SHIFT | NEWSHIFT | S/N | NAME | SHIFT | NEWSHIFT | S/N |
| 0 | 11410073 | 0.479146 | 0.00000 | 206.401 | 11410074 | -0.000562269 | 0.479708 | 205.415 |
| 1 | 11410072 | 0.478498 | 0.000647992 | 202.346 | 11410067 | 0.00000 | 0.479146 | 198.793 |
| 2 | 11410069 | 0.477305 | 0.00184101 | 192.357 | 11410070 | -0.00246258 | 0.481609 | 198.077 |
| 3 | 11410068 | 0.477550 | 0.00159600 | 157.840 | 11410071 | -0.00224465 | 0.481391 | 194.207 |