| Red | Green | Blue | |
| z | 17.64 | ||
| znorm | Inf | ||
| sky | -Inf | -Inf | -Inf |
| S/N | 23.8 | 42.5 | 46.0 |
| S/N(c) | 0.0 | 0.0 | 0.0 |
| SN(E/C) |
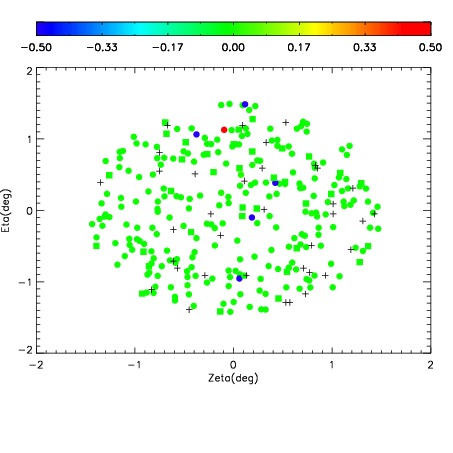

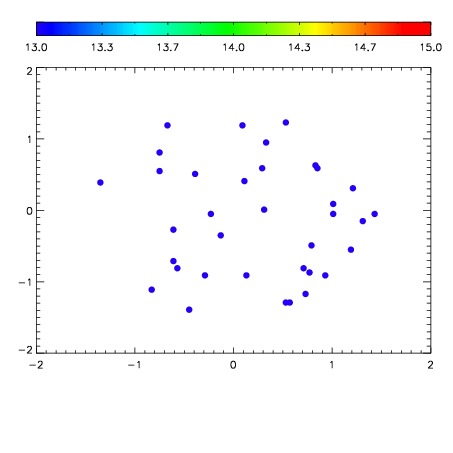

| Frame | Nreads | Zeropoints | Mag plots | Spatial mag deviation | Spatial sky 16325A emission deviations (filled: sky, open: star) | Spatial sky continuum emission | Spatial sky telluric CO2 absorption deviations (filled: H < 10) | |||||||||||||||||||||||
| 0 | 0 |
|
|
|
|
|
|
| IPAIR | NAME | SHIFT | NEWSHIFT | S/N | NAME | SHIFT | NEWSHIFT | S/N |
| 0 | 11670068 | 0.487203 | 0.00000 | 200.019 | 11670069 | -0.00353891 | 0.490742 | 207.561 |
| 1 | 11670063 | 0.485948 | 0.00125501 | 220.274 | 11670065 | -0.00396207 | 0.491165 | 219.296 |
| 2 | 11670064 | 0.486973 | 0.000230014 | 219.812 | 11670062 | 0.00000 | 0.487203 | 213.051 |
| 3 | 11670067 | 0.486173 | 0.00103000 | 207.807 | 11670066 | -0.00307490 | 0.490278 | 211.414 |