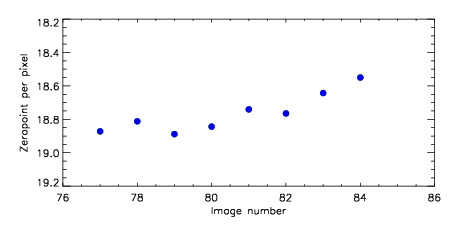
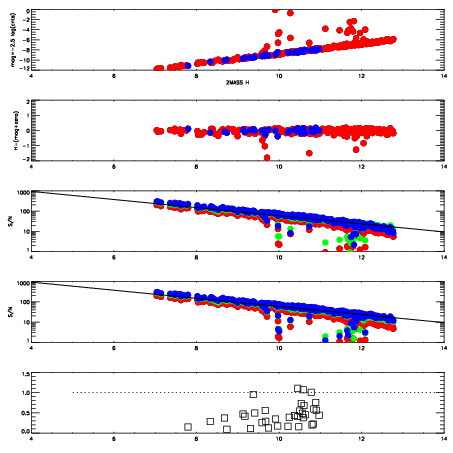
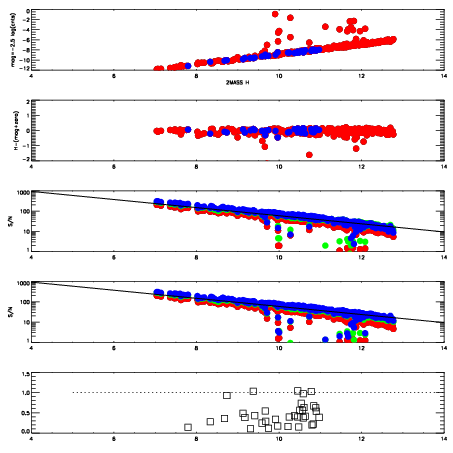
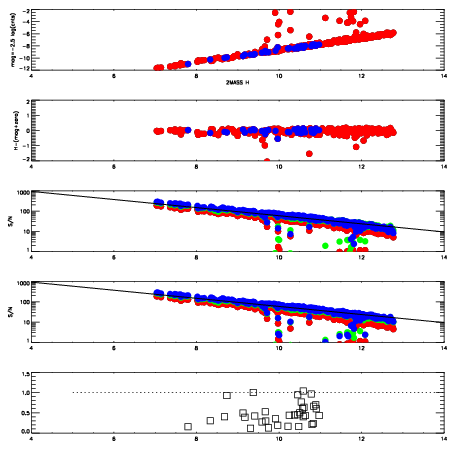
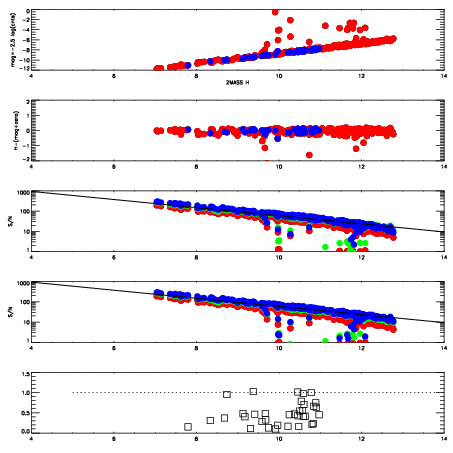
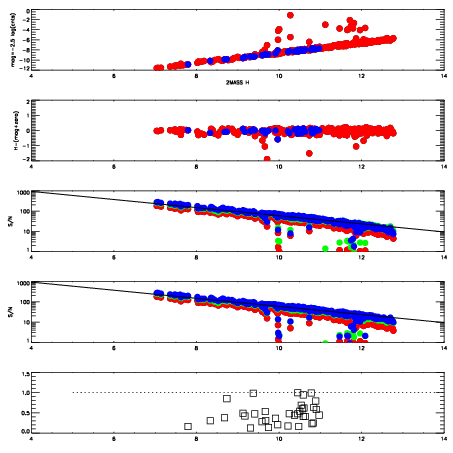
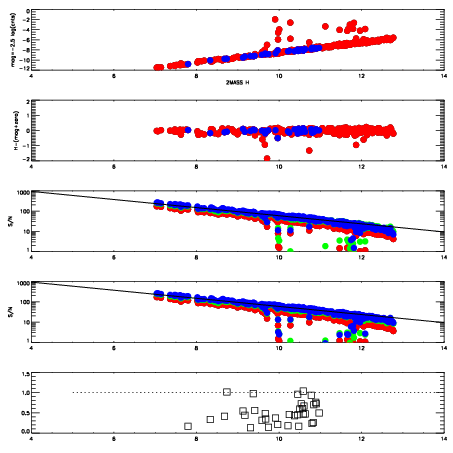
| Frame | Nreads | Zeropoints | Mag plots
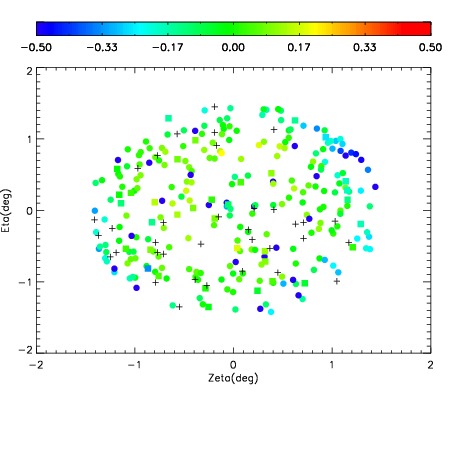
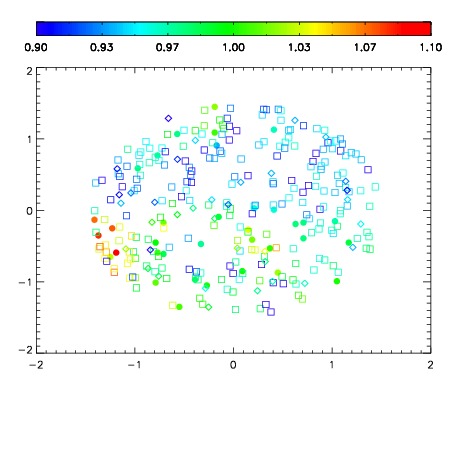
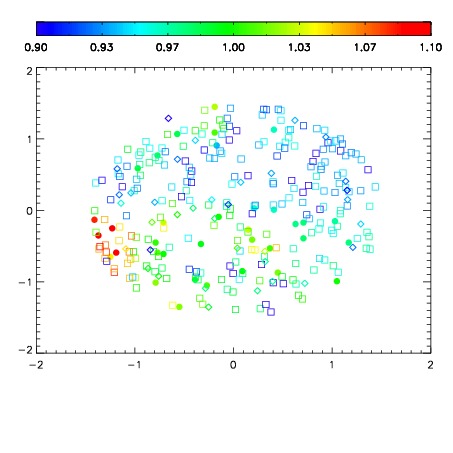
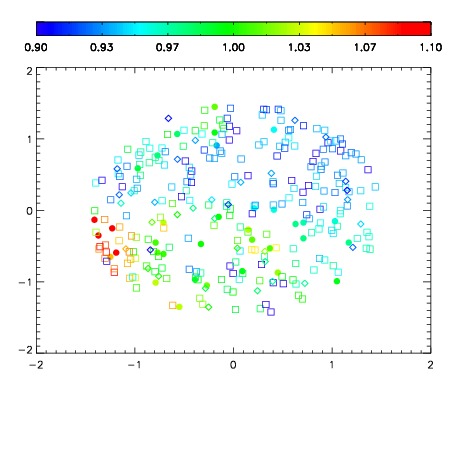
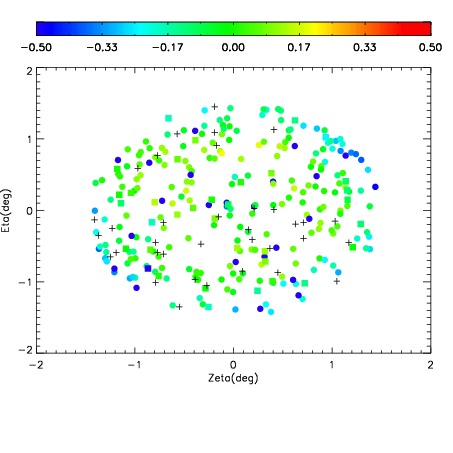
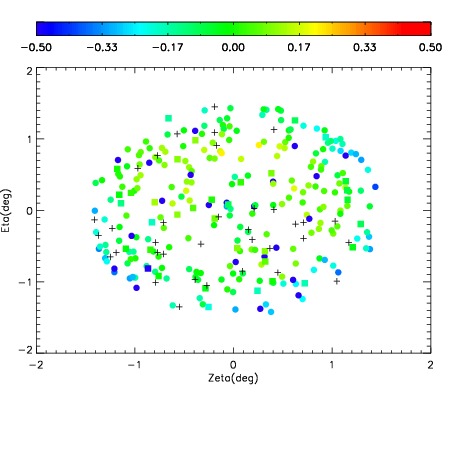
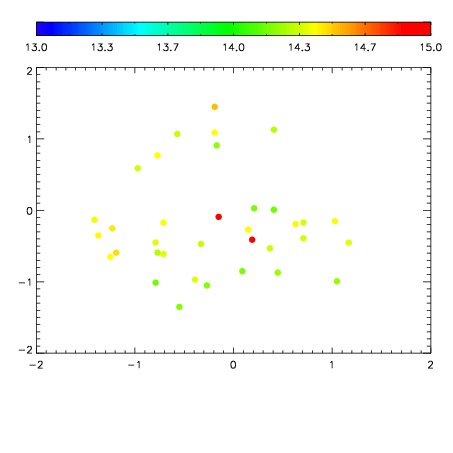
| Spatial mag deviation
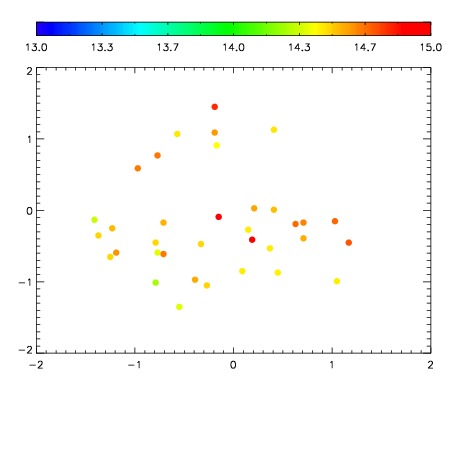
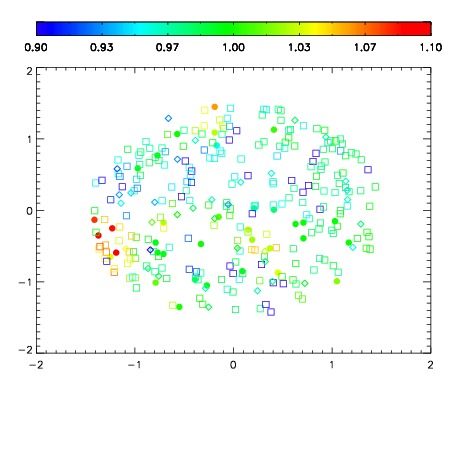
| Spatial sky 16325A emission deviations (filled: sky, open: star)
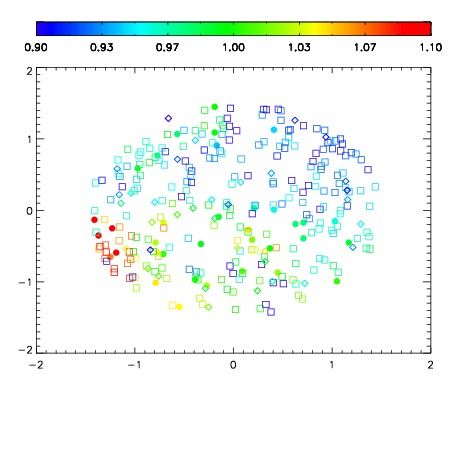
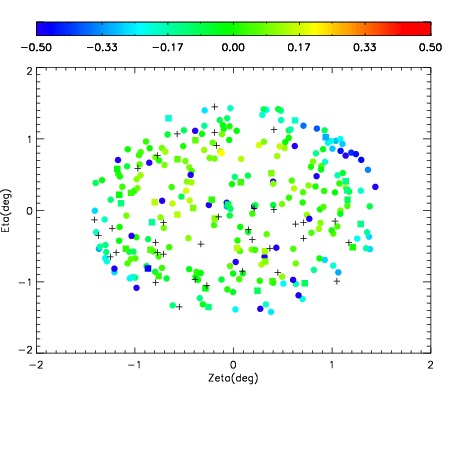
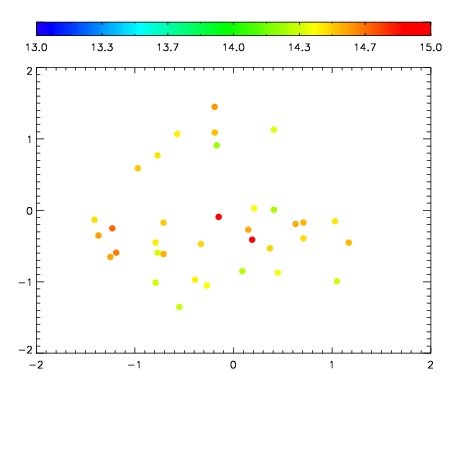
| Spatial sky continuum emission
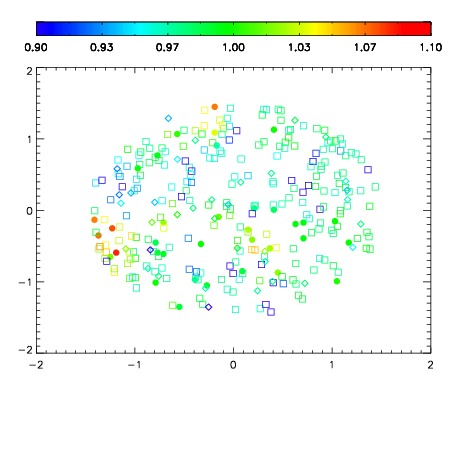
| Spatial sky telluric CO2 absorption deviations (filled: H < 10)
|
| 11390077
| 47
| | Red | Green | Blue
| | z | | 18.87
| | znorm | | 14.69
| | sky | 14.9 | 14.5 | 13.5
| | S/N | 14.2 | 23.2 | 20.4
| | S/N(c) | 12.3 | 21.3 | 23.0
| | SN(E/C) 0.42
|
| 
| 
| 
| 
| 
|
| 11390078
| 47
| | Red | Green | Blue
| | z | | 18.81
| | znorm | | 14.63
| | sky | 15.2 | 14.7 | 13.8
| | S/N | 13.2 | 22.4 | 20.6
| | S/N(c) | 11.5 | 20.6 | 22.4
| | SN(E/C) 0.41
|
| 
| 
| 
| 
| 
|
| 11390079
| 47
| | Red | Green | Blue
| | z | | 18.89
| | znorm | | 14.71
| | sky | 15.0 | 14.7 | 13.8
| | S/N | 14.3 | 23.7 | 22.3
| | S/N(c) | 12.3 | 21.6 | 23.4
| | SN(E/C) 0.40
|
| 
| 
| 
| 
| 
|
| 11390080
| 47
| | Red | Green | Blue
| | z | | 18.84
| | znorm | | 14.66
| | sky | 14.9 | 14.5 | 13.8
| | S/N | 13.6 | 22.6 | 21.8
| | S/N(c) | 11.7 | 20.8 | 22.8
| | SN(E/C) 0.42
|
| 
| 
| 
| 
| 
|
| 11390081
| 47
| | Red | Green | Blue
| | z | | 18.74
| | znorm | | 14.56
| | sky | 14.5 | 14.4 | 13.9
| | S/N | 12.6 | 21.7 | 20.4
| | S/N(c) | 10.9 | 19.8 | 21.2
| | SN(E/C) 0.43
|
| 
| 
| 
| 
| 
|
| 11390082
| 47
| | Red | Green | Blue
| | z | | 18.76
| | znorm | | 14.58
| | sky | 14.7 | 14.5 | 13.9
| | S/N | 13.0 | 21.8 | 20.8
| | S/N(c) | 11.1 | 19.8 | 21.5
| | SN(E/C) 0.45
|
| 
| 
| 
| 
| 
|
| 11390083
| 47
| | Red | Green | Blue
| | z | | 18.64
| | znorm | | 14.46
| | sky | 14.5 | 14.4 | 13.8
| | S/N | 11.8 | 20.5 | 19.3
| | S/N(c) | 10.0 | 18.5 | 20.4
| | SN(E/C) 0.44
|
| 
| 
| 
| 
| 
|
| 11390084
| 47
| | Red | Green | Blue
| | z | | 18.55
| | znorm | | 14.37
| | sky | 14.5 | 14.4 | 13.8
| | S/N | 11.4 | 19.6 | 18.1
| | S/N(c) | 9.7 | 17.5 | 18.8
| | SN(E/C) 0.47
|
| 
| 
| 
| 
| 
|