| Red | Green | Blue | |
| z | 17.64 | ||
| znorm | Inf | ||
| sky | -Inf | -Inf | -Inf |
| S/N | 22.3 | 40.0 | 43.4 |
| S/N(c) | 0.0 | 0.0 | 0.0 |
| SN(E/C) |

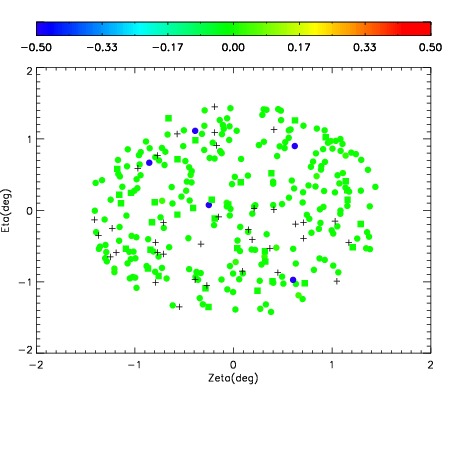
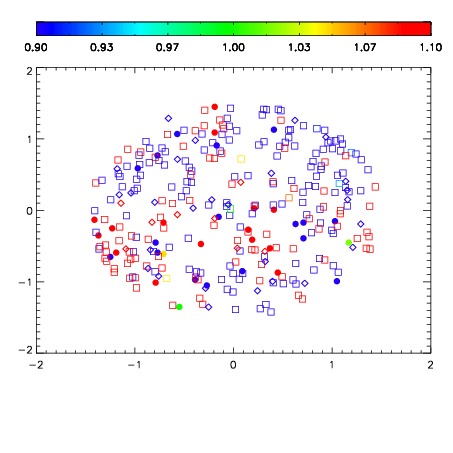
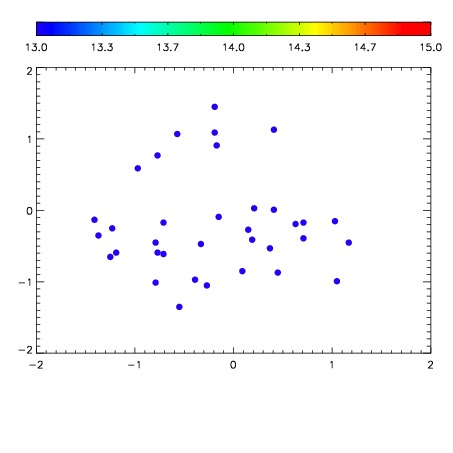

| Frame | Nreads | Zeropoints | Mag plots | Spatial mag deviation | Spatial sky 16325A emission deviations (filled: sky, open: star) | Spatial sky continuum emission | Spatial sky telluric CO2 absorption deviations (filled: H < 10) | |||||||||||||||||||||||
| 0 | 0 |
|
|
|
|
|
|
| IPAIR | NAME | SHIFT | NEWSHIFT | S/N | NAME | SHIFT | NEWSHIFT | S/N |
| 0 | 11390083 | 0.475528 | 0.00000 | 191.965 | 11390084 | 0.000485669 | 0.475042 | 184.599 |
| 1 | 11390079 | 0.473529 | 0.00199899 | 220.393 | 11390077 | 0.00000 | 0.475528 | 221.161 |
| 2 | 11390078 | 0.472781 | 0.00274700 | 216.838 | 11390080 | -0.00242133 | 0.477949 | 216.686 |
| 3 | 11390082 | 0.474309 | 0.00121900 | 206.888 | 11390081 | -0.00253012 | 0.478058 | 204.630 |