| Red | Green | Blue | |
| z | 17.64 | ||
| znorm | Inf | ||
| sky | -Inf | -Inf | -Inf |
| S/N | 27.5 | 47.9 | 52.1 |
| S/N(c) | 0.0 | 0.0 | 0.0 |
| SN(E/C) |
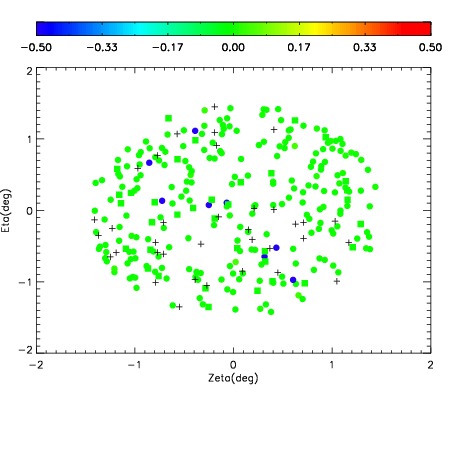
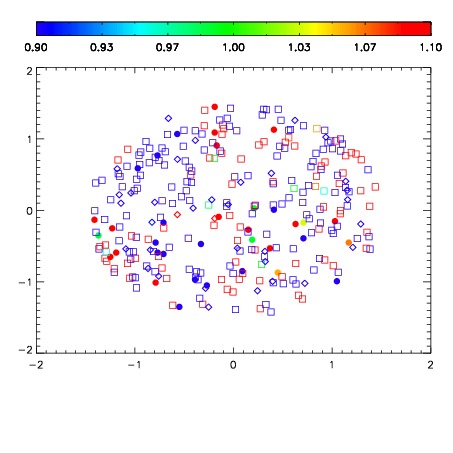
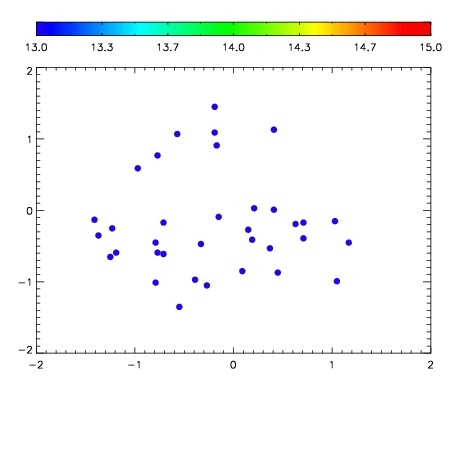

| Frame | Nreads | Zeropoints | Mag plots | Spatial mag deviation | Spatial sky 16325A emission deviations (filled: sky, open: star) | Spatial sky continuum emission | Spatial sky telluric CO2 absorption deviations (filled: H < 10) | |||||||||||||||||||||||
| 0 | 0 |
|
|
|
|
|
|
| IPAIR | NAME | SHIFT | NEWSHIFT | S/N | NAME | SHIFT | NEWSHIFT | S/N |
| 0 | 11650055 | 0.493678 | 0.00000 | 231.334 | 11650054 | 0.00000 | 0.493678 | 225.331 |
| 1 | 11650056 | 0.493412 | 0.000266016 | 235.578 | 11650061 | -0.00301421 | 0.496692 | 235.988 |
| 2 | 11650060 | 0.491989 | 0.00168902 | 234.374 | 11650057 | -0.00186141 | 0.495539 | 233.782 |
| 3 | 11650059 | 0.491687 | 0.00199100 | 233.755 | 11650058 | -0.00208640 | 0.495764 | 230.793 |