| Red | Green | Blue | |
| z | 17.64 | ||
| znorm | Inf | ||
| sky | -NaN | -Inf | -Inf |
| S/N | 16.4 | 28.6 | 31.9 |
| S/N(c) | 0.0 | 0.0 | 0.0 |
| SN(E/C) |

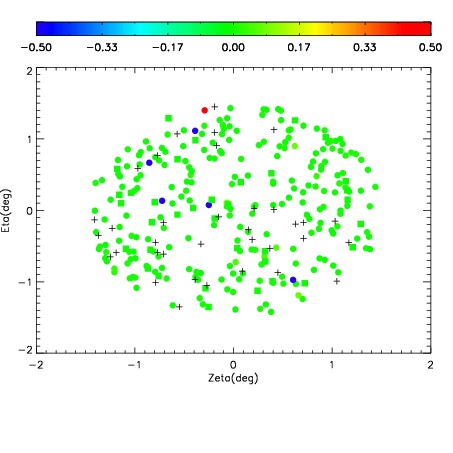
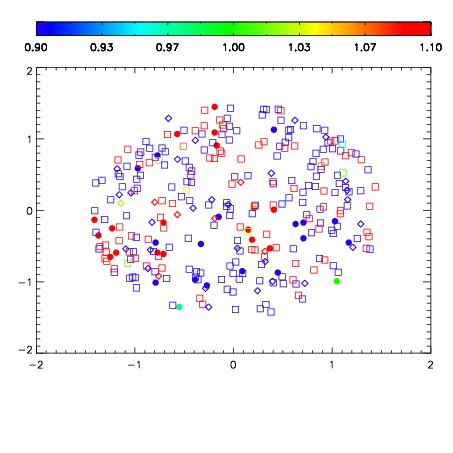
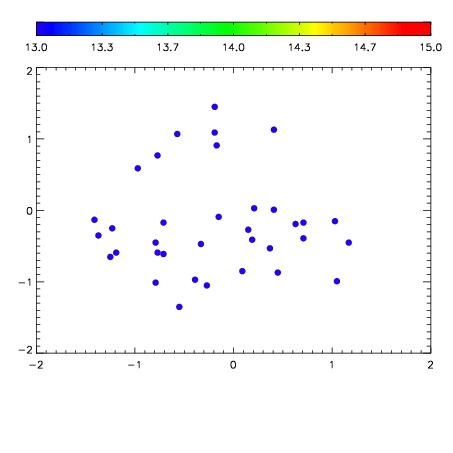

| Frame | Nreads | Zeropoints | Mag plots | Spatial mag deviation | Spatial sky 16325A emission deviations (filled: sky, open: star) | Spatial sky continuum emission | Spatial sky telluric CO2 absorption deviations (filled: H < 10) | |||||||||||||||||||||||
| 0 | 0 |
|
|
|
|
|
|
| IPAIR | NAME | SHIFT | NEWSHIFT | S/N | NAME | SHIFT | NEWSHIFT | S/N |
| 0 | 11730061 | 0.493055 | 0.00000 | 173.955 | 11730055 | 0.00000 | 0.493055 | 143.066 |
| 1 | 11730060 | 0.492848 | 0.000206977 | 191.349 | 11730062 | 0.000547108 | 0.492508 | 189.265 |
| 2 | 11730057 | 0.490478 | 0.00257698 | 179.646 | 11730059 | -0.000628919 | 0.493684 | 176.395 |
| 3 | 11730056 | 0.490788 | 0.00226697 | 153.267 | 11730058 | 2.76216e-05 | 0.493027 | 123.992 |