| Red | Green | Blue | |
| z | 17.64 | ||
| znorm | Inf | ||
| sky | -Inf | -Inf | -Inf |
| S/N | 17.5 | 30.5 | 36.3 |
| S/N(c) | 0.0 | 0.0 | 0.0 |
| SN(E/C) |
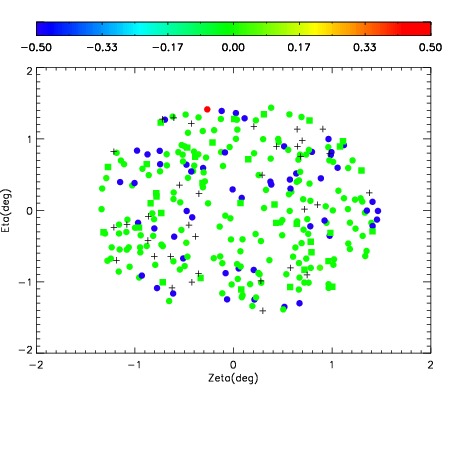
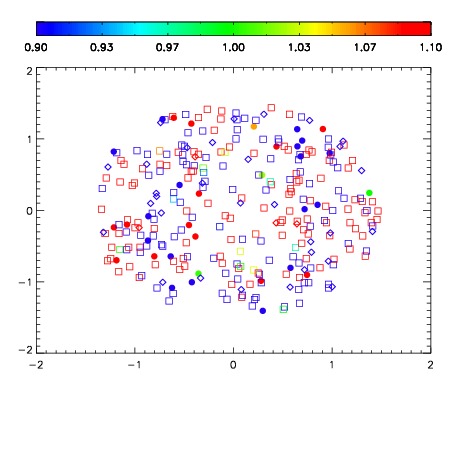
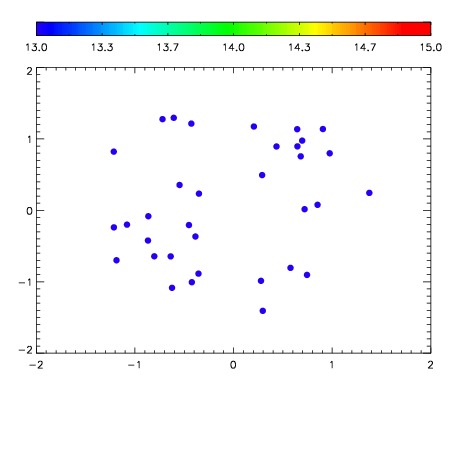

| Frame | Nreads | Zeropoints | Mag plots | Spatial mag deviation | Spatial sky 16325A emission deviations (filled: sky, open: star) | Spatial sky continuum emission | Spatial sky telluric CO2 absorption deviations (filled: H < 10) | |||||||||||||||||||||||
| 0 | 0 |
|
|
|
|
|
|
| IPAIR | NAME | SHIFT | NEWSHIFT | S/N | NAME | SHIFT | NEWSHIFT | S/N |
| 0 | 11390061 | 0.473383 | 0.00000 | 127.597 | 11390062 | -0.00124583 | 0.474629 | 150.264 |
| 1 | 11390056 | 0.471434 | 0.00194901 | 161.103 | 11390055 | 0.00000 | 0.473383 | 164.088 |
| 2 | 11390057 | 0.472165 | 0.00121802 | 148.312 | 11390059 | 0.000587956 | 0.472795 | 156.113 |
| 3 | 11390060 | 0.472425 | 0.000957996 | 146.714 | 11390058 | -0.000470053 | 0.473853 | 154.677 |