| Red | Green | Blue | |
| z | 17.64 | ||
| znorm | Inf | ||
| sky | -Inf | -Inf | -Inf |
| S/N | 23.7 | 39.5 | 47.4 |
| S/N(c) | 0.0 | 0.0 | 0.0 |
| SN(E/C) |
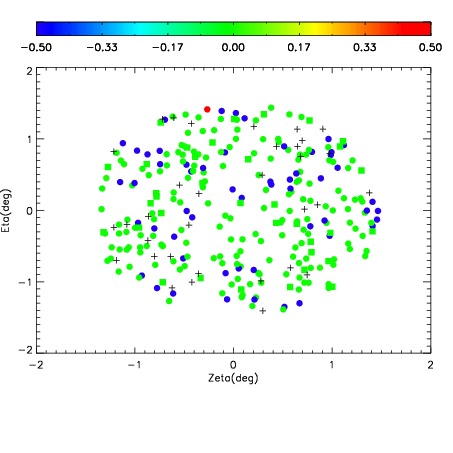
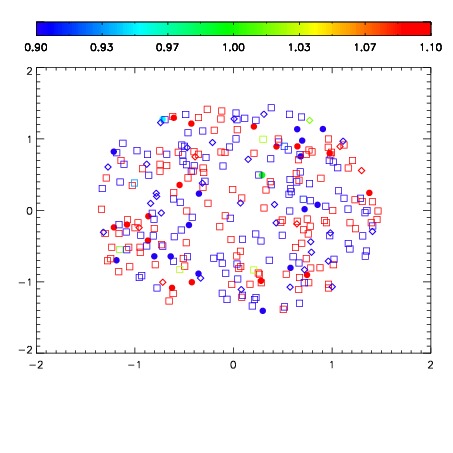
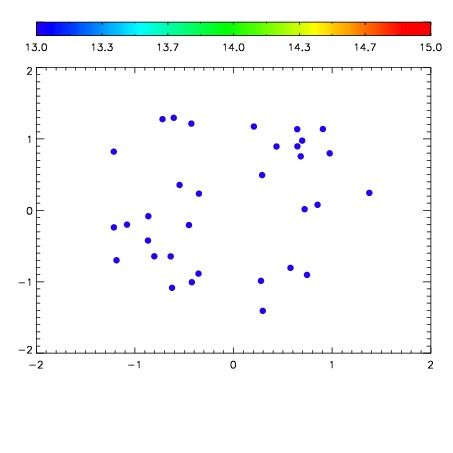

| Frame | Nreads | Zeropoints | Mag plots | Spatial mag deviation | Spatial sky 16325A emission deviations (filled: sky, open: star) | Spatial sky continuum emission | Spatial sky telluric CO2 absorption deviations (filled: H < 10) | |||||||||||||||||||||||
| 0 | 0 |
|
|
|
|
|
|
| IPAIR | NAME | SHIFT | NEWSHIFT | S/N | NAME | SHIFT | NEWSHIFT | S/N |
| 0 | 11450035 | 0.473079 | 0.00000 | 179.339 | 11450037 | -0.00253485 | 0.475614 | 177.228 |
| 1 | 11450038 | 0.471310 | 0.00176901 | 188.187 | 11450036 | -0.00212259 | 0.475202 | 182.304 |
| 2 | 11450034 | 0.472209 | 0.000869989 | 181.990 | 11450040 | -0.00335860 | 0.476438 | 181.012 |
| 3 | 11450039 | 0.471871 | 0.00120801 | 171.886 | 11450033 | 0.00000 | 0.473079 | 161.362 |