| Red | Green | Blue | |
| z | 17.64 | ||
| znorm | Inf | ||
| sky | -Inf | -Inf | -Inf |
| S/N | 25.9 | 42.1 | 52.3 |
| S/N(c) | 0.0 | 0.0 | 0.0 |
| SN(E/C) |
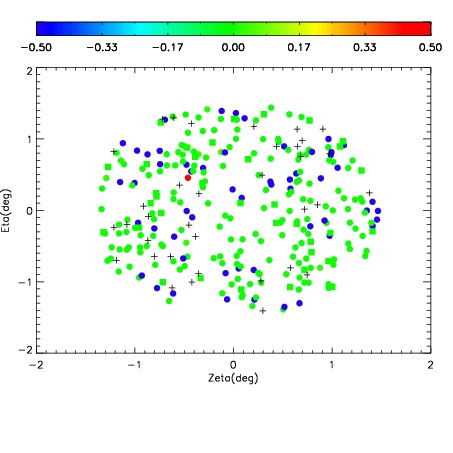
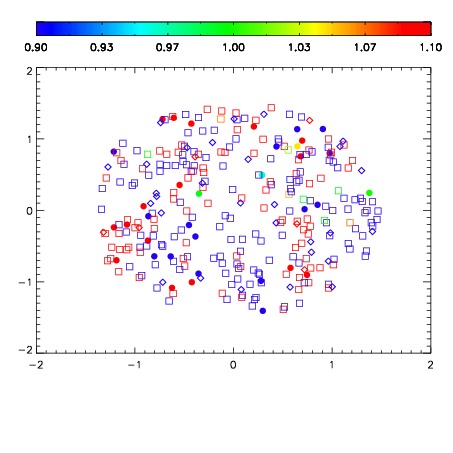
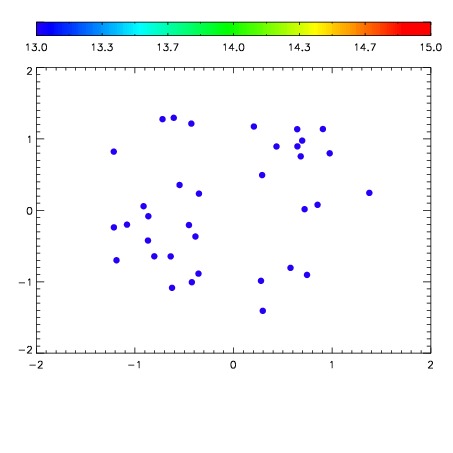

| Frame | Nreads | Zeropoints | Mag plots | Spatial mag deviation | Spatial sky 16325A emission deviations (filled: sky, open: star) | Spatial sky continuum emission | Spatial sky telluric CO2 absorption deviations (filled: H < 10) | |||||||||||||||||||||||
| 0 | 0 |
|
|
|
|
|
|
| IPAIR | NAME | SHIFT | NEWSHIFT | S/N | NAME | SHIFT | NEWSHIFT | S/N |
| 0 | 11950023 | 0.503575 | 0.00000 | 191.278 | 11950024 | -0.000129662 | 0.503705 | 197.313 |
| 1 | 11950027 | 0.503140 | 0.000435054 | 220.273 | 11950021 | 0.00000 | 0.503575 | 221.139 |
| 2 | 11950022 | 0.502959 | 0.000616014 | 215.217 | 11950028 | 0.000895588 | 0.502679 | 216.741 |
| 3 | 11950026 | 0.502603 | 0.000972033 | 212.543 | 11950025 | -0.000180925 | 0.503756 | 208.200 |