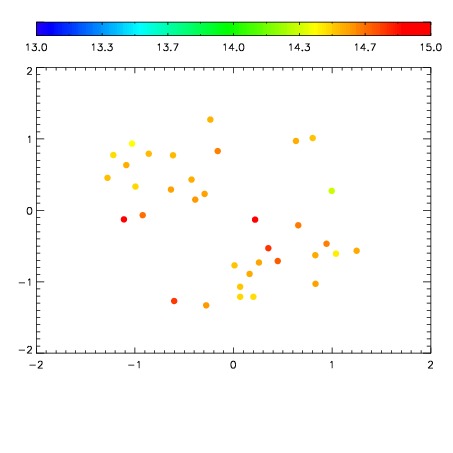
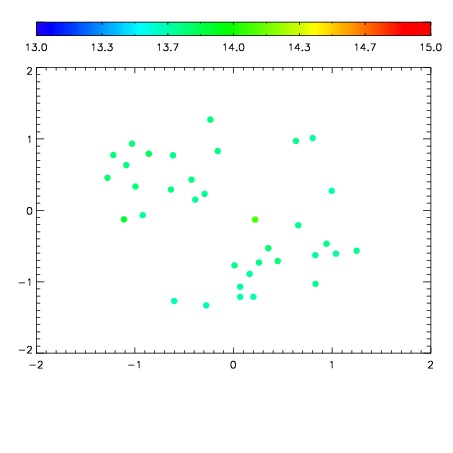
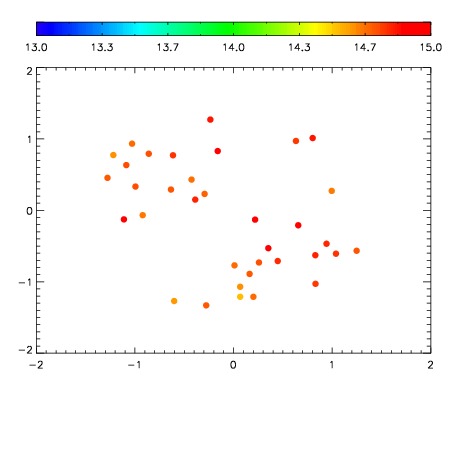
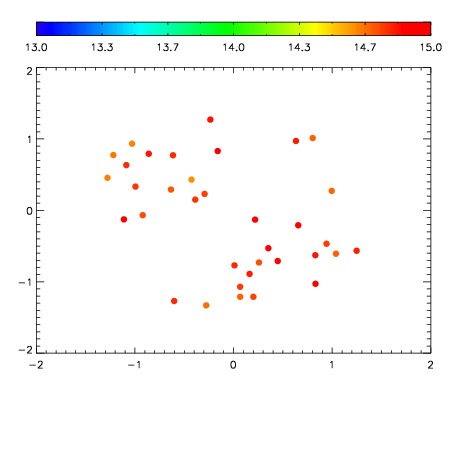
| Frame | Nreads | Zeropoints | Mag plots
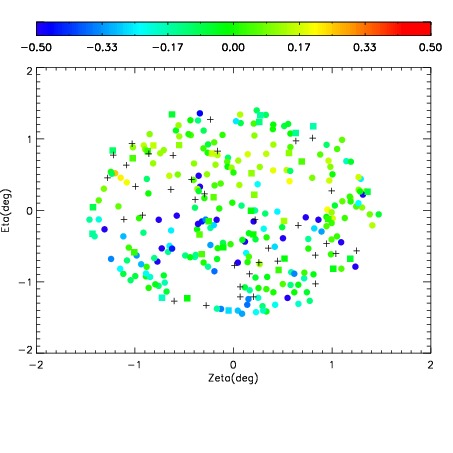
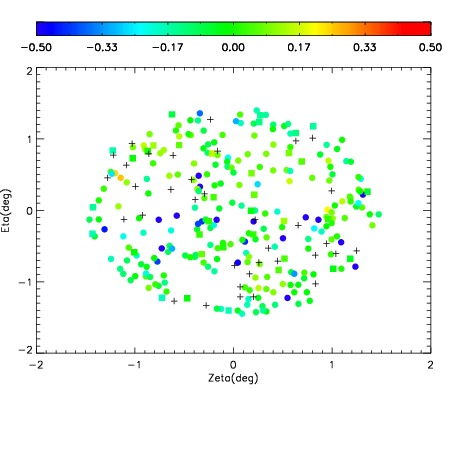
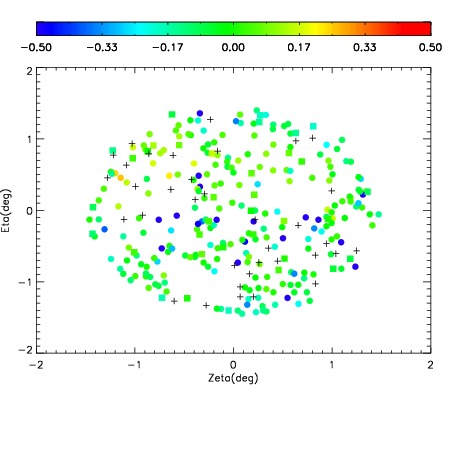
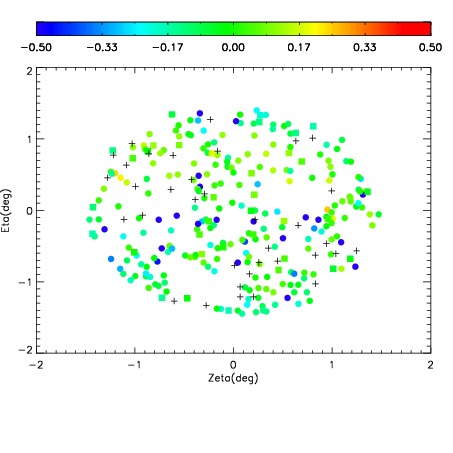
| Spatial mag deviation
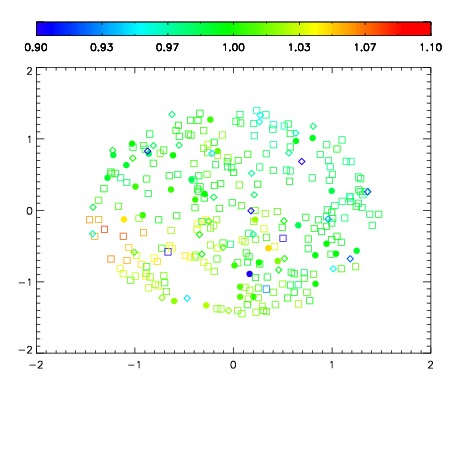
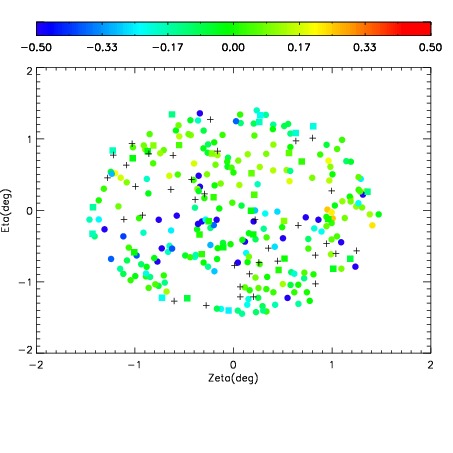
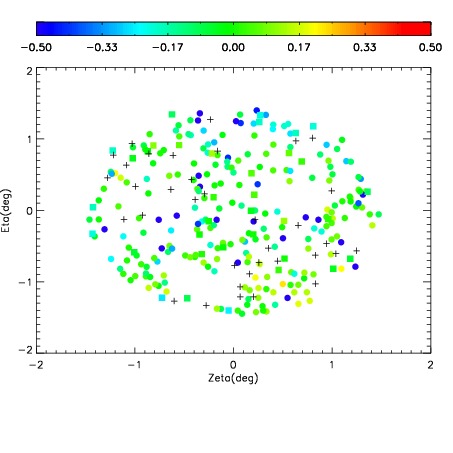
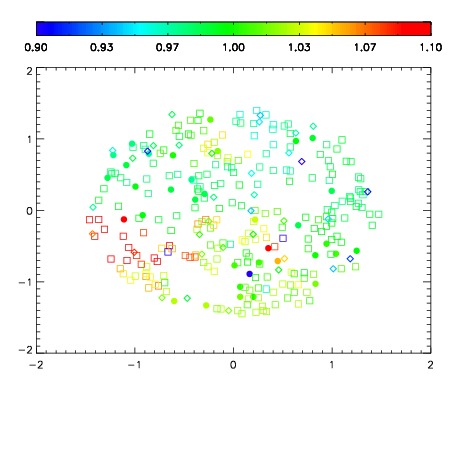
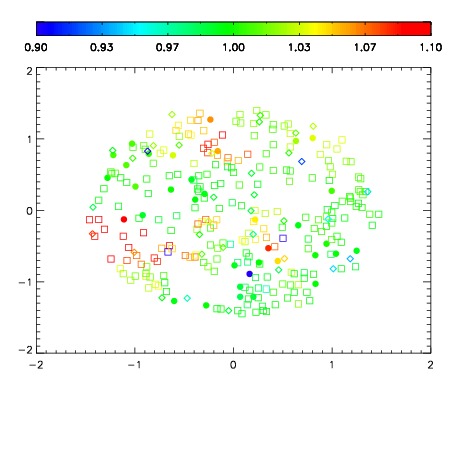
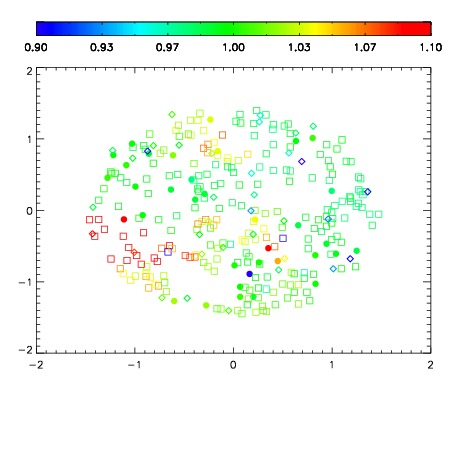
| Spatial sky 16325A emission deviations (filled: sky, open: star)
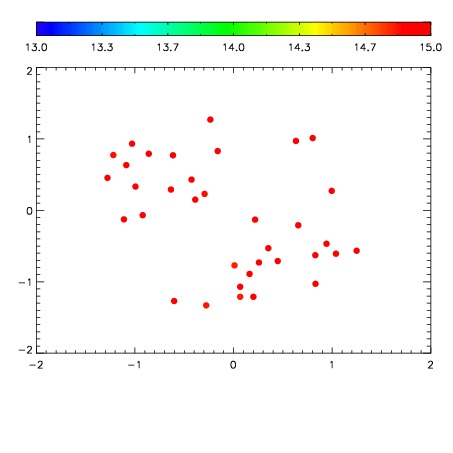
| Spatial sky continuum emission
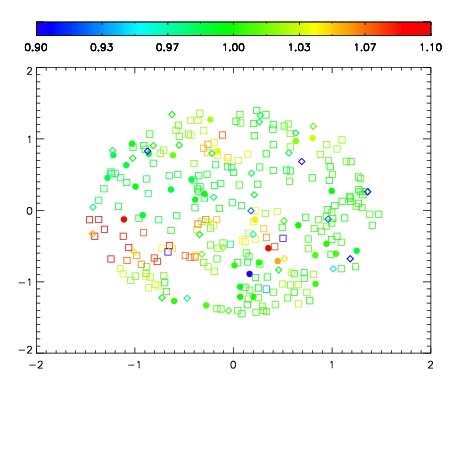
| Spatial sky telluric CO2 absorption deviations (filled: H < 10)
|
| 12290024
| 47
| | Red | Green | Blue
| | z | | 17.91
| | znorm | | 13.73
| | sky | 14.9 | 14.6 | 14.4
| | S/N | 7.1 | 13.5 | 13.1
| | S/N(c) | 6.2 | 12.4 | 12.3
| | SN(E/C) 0.56
|
| 
| 
| 
| 
| 
|
| 12290025
| 47
| | Red | Green | Blue
| | z | | 17.84
| | znorm | | 13.66
| | sky | 13.9 | 13.7 | 13.7
| | S/N | 6.1 | 11.2 | 11.7
| | S/N(c) | 5.2 | 10.0 | 11.0
| | SN(E/C) 0.60
|
| 
| 
| 
| 
| 
|
| 12290026
| 47
| | Red | Green | Blue
| | z | | 17.95
| | znorm | | 13.77
| | sky | 13.8 | 13.7 | 13.6
| | S/N | 6.4 | 11.8 | 12.1
| | S/N(c) | 5.7 | 10.9 | 11.7
| | SN(E/C) 0.54
|
| 
| 
| 
| 
| 
|
| 12290027
| 47
| | Red | Green | Blue
| | z | | 17.82
| | znorm | | 13.64
| | sky | 15.0 | 14.7 | 14.9
| | S/N | 6.3 | 12.2 | 12.5
| | S/N(c) | 5.5 | 11.1 | 11.7
| | SN(E/C) 0.55
|
| 
| 
| 
| 
| 
|
| 12290028
| 47
| | Red | Green | Blue
| | z | | 18.02
| | znorm | | 13.84
| | sky | 15.0 | 14.8 | 14.9
| | S/N | 7.0 | 13.9 | 14.0
| | S/N(c) | 6.1 | 12.4 | 13.0
| | SN(E/C) 0.50
|
| 
| 
| 
| 
| 
|
| 12290029
| 47
| | Red | Green | Blue
| | z | | 17.82
| | znorm | | 13.64
| | sky | 15.0 | 14.9 | 15.1
| | S/N | 5.9 | 12.1 | 12.5
| | S/N(c) | 5.2 | 10.8 | 11.8
| | SN(E/C) 0.52
|
| 
| 
| 
| 
| 
|
| 12290030
| 47
| | Red | Green | Blue
| | z | | 17.98
| | znorm | | 13.80
| | sky | 15.0 | 14.9 | 15.0
| | S/N | 7.2 | 14.0 | 14.2
| | S/N(c) | 6.2 | 12.6 | 13.2
| | SN(E/C) 0.50
|
| 
| 
| 
| 
| 
|
| 12290031
| 47
| | Red | Green | Blue
| | z | | 18.04
| | znorm | | 13.86
| | sky | 15.0 | 15.0 | 15.1
| | S/N | 7.4 | 14.3 | 14.4
| | S/N(c) | 6.3 | 12.9 | 13.5
| | SN(E/C) 0.51
|
| 
| 
| 
| 
| 
|