| Red | Green | Blue | |
| z | 17.64 | ||
| znorm | Inf | ||
| sky | -NaN | -Inf | -Inf |
| S/N | 11.5 | 23.3 | 24.5 |
| S/N(c) | 0.0 | 0.0 | 0.0 |
| SN(E/C) |
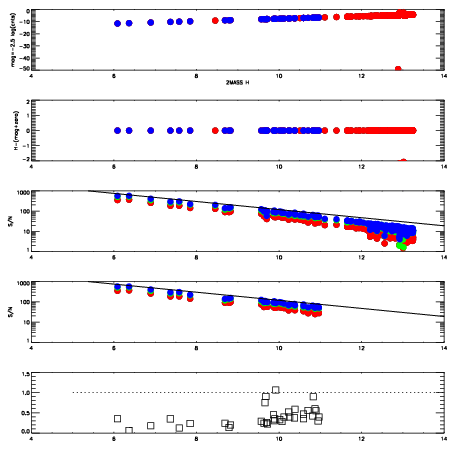
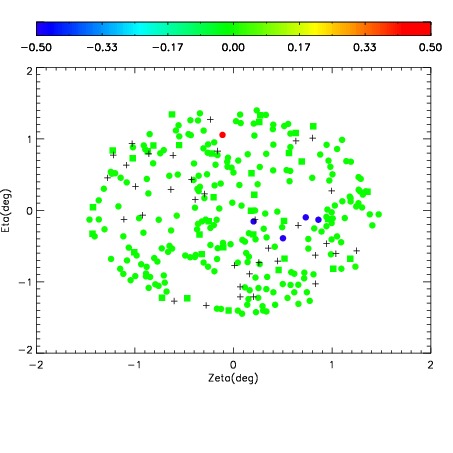
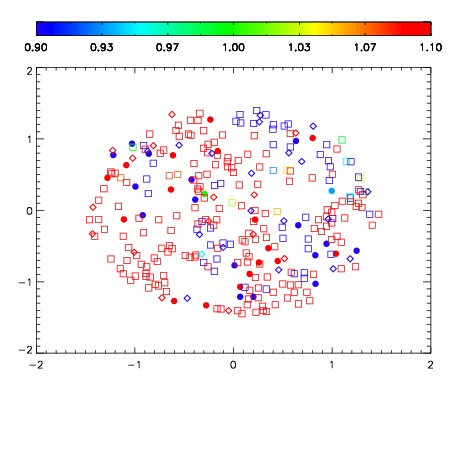
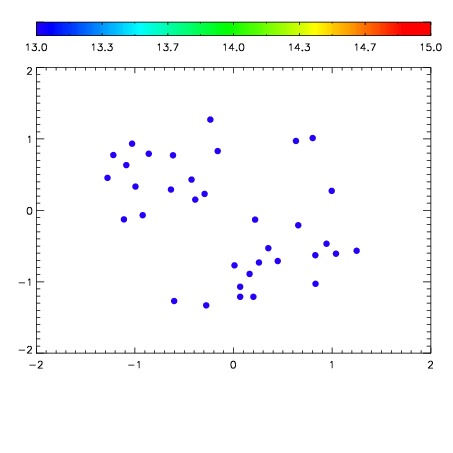

| Frame | Nreads | Zeropoints | Mag plots | Spatial mag deviation | Spatial sky 16325A emission deviations (filled: sky, open: star) | Spatial sky continuum emission | Spatial sky telluric CO2 absorption deviations (filled: H < 10) | |||||||||||||||||||||||
| 0 | 0 |
|
|
|
|
|
|
| IPAIR | NAME | SHIFT | NEWSHIFT | S/N | NAME | SHIFT | NEWSHIFT | S/N |
| 0 | 12290030 | 0.497243 | 0.00000 | 138.782 | 12290031 | 0.000965117 | 0.496278 | 141.926 |
| 1 | 12290026 | 0.495304 | 0.00193900 | 134.963 | 12290028 | -7.60307e-05 | 0.497319 | 139.331 |
| 2 | 12290025 | 0.495733 | 0.00150999 | 128.092 | 12290024 | 0.00000 | 0.497243 | 135.220 |
| 3 | 12290029 | 0.496739 | 0.000503987 | 126.497 | 12290027 | -0.000597503 | 0.497840 | 128.918 |