| Red | Green | Blue | |
| z | 17.64 | ||
| znorm | Inf | ||
| sky | -Inf | -Inf | -Inf |
| S/N | 23.7 | 41.9 | 44.1 |
| S/N(c) | 0.0 | 0.0 | 0.0 |
| SN(E/C) |
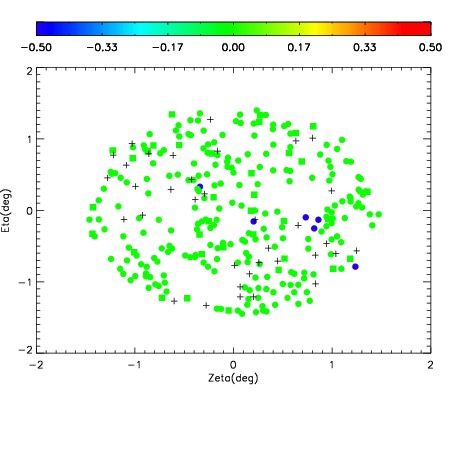
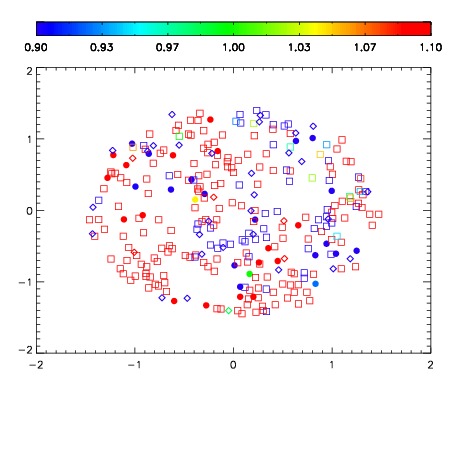
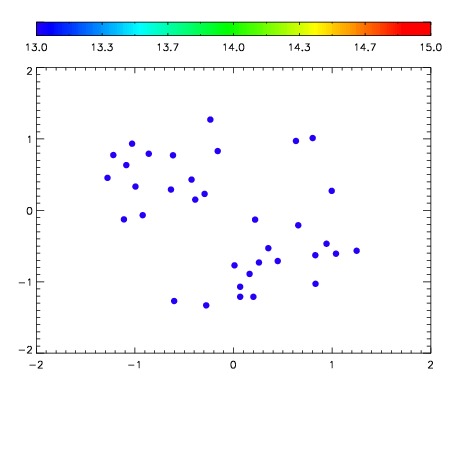

| Frame | Nreads | Zeropoints | Mag plots | Spatial mag deviation | Spatial sky 16325A emission deviations (filled: sky, open: star) | Spatial sky continuum emission | Spatial sky telluric CO2 absorption deviations (filled: H < 10) | |||||||||||||||||||||||
| 0 | 0 |
|
|
|
|
|
|
| IPAIR | NAME | SHIFT | NEWSHIFT | S/N | NAME | SHIFT | NEWSHIFT | S/N |
| 0 | 12330013 | 0.498631 | 0.00000 | 217.286 | 12330015 | -0.00143694 | 0.500068 | 217.827 |
| 1 | 12330012 | 0.497975 | 0.000656009 | 221.104 | 12330011 | 0.00000 | 0.498631 | 223.343 |
| 2 | 12330016 | 0.497627 | 0.00100401 | 219.037 | 12330014 | -0.00171880 | 0.500350 | 221.464 |
| 3 | 12330017 | 0.498000 | 0.000631005 | 207.726 | 12330018 | -0.00236190 | 0.500993 | 215.613 |