| Red | Green | Blue | |
| z | 17.65 | ||
| znorm | Inf | ||
| sky | -Inf | -Inf | -Inf |
| S/N | 8.3 | 18.2 | 19.0 |
| S/N(c) | 0.0 | 0.0 | 0.0 |
| SN(E/C) |
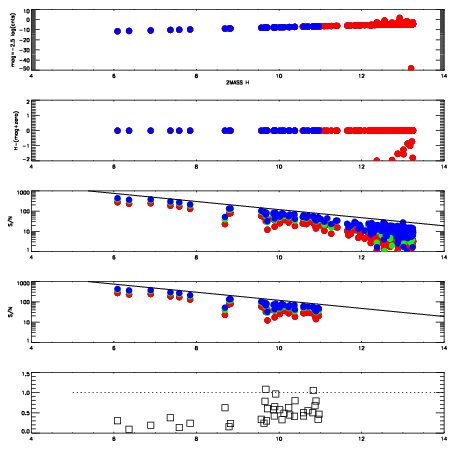

| Frame | Nreads | Zeropoints | Mag plots | Spatial mag deviation | Spatial sky 16325A emission deviations (filled: sky, open: star) | Spatial sky continuum emission | Spatial sky telluric CO2 absorption deviations (filled: H < 10) | |||||||||||||||||||||||
| 0 | 0 |
|
|
|
|
|
|
| IPAIR | NAME | SHIFT | NEWSHIFT | S/N | NAME | SHIFT | NEWSHIFT | S/N |
| 0 | 12260039 | 0.490505 | 0.00000 | 120.653 | 12260040 | -0.00213138 | 0.492636 | 117.868 |
| 1 | 12260034 | 0.489405 | 0.00110000 | 123.367 | 12260033 | 0.00000 | 0.490505 | 125.741 |
| 2 | 12260035 | 0.489698 | 0.000807017 | 122.654 | 12260036 | -0.00385668 | 0.494362 | 124.902 |
| 3 | 12260038 | 0.489572 | 0.000933021 | 120.961 | 12260037 | -0.00305999 | 0.493565 | 120.641 |