| Red | Green | Blue | |
| z | 17.64 | ||
| znorm | Inf | ||
| sky | -Inf | -Inf | -Inf |
| S/N | 28.8 | 50.5 | 52.8 |
| S/N(c) | 0.0 | 0.0 | 0.0 |
| SN(E/C) |
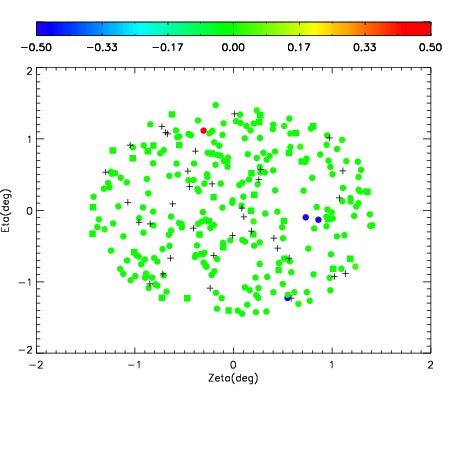
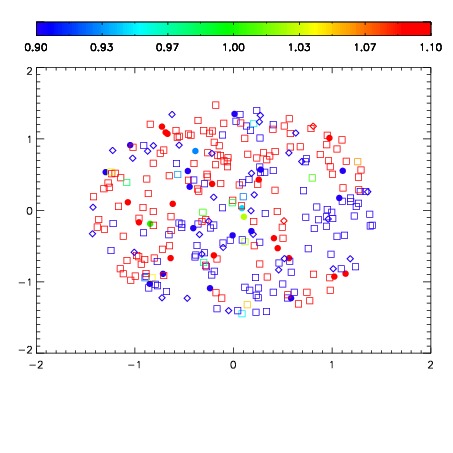
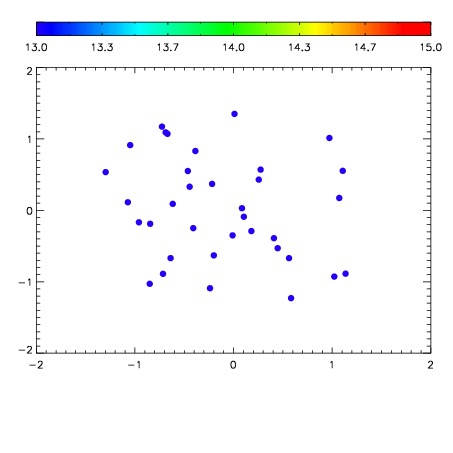

| Frame | Nreads | Zeropoints | Mag plots | Spatial mag deviation | Spatial sky 16325A emission deviations (filled: sky, open: star) | Spatial sky continuum emission | Spatial sky telluric CO2 absorption deviations (filled: H < 10) | |||||||||||||||||||||||
| 0 | 0 |
|
|
|
|
|
|
| IPAIR | NAME | SHIFT | NEWSHIFT | S/N | NAME | SHIFT | NEWSHIFT | S/N |
| 0 | 12250038 | 0.489856 | 0.00000 | 229.665 | 12250040 | -0.00898952 | 0.498846 | 231.298 |
| 1 | 12250042 | 0.486432 | 0.00342402 | 232.698 | 12250041 | -0.00863895 | 0.498495 | 232.861 |
| 2 | 12250039 | 0.489488 | 0.000367999 | 231.850 | 12250037 | 0.00000 | 0.489856 | 232.138 |
| 3 | 12250043 | 0.487067 | 0.00278899 | 225.934 | 12250044 | -0.00788383 | 0.497740 | 229.098 |