| Red | Green | Blue | |
| z | 17.65 | ||
| znorm | Inf | ||
| sky | -Inf | -Inf | -Inf |
| S/N | 28.2 | 49.4 | 53.2 |
| S/N(c) | 0.0 | 0.0 | 0.0 |
| SN(E/C) |
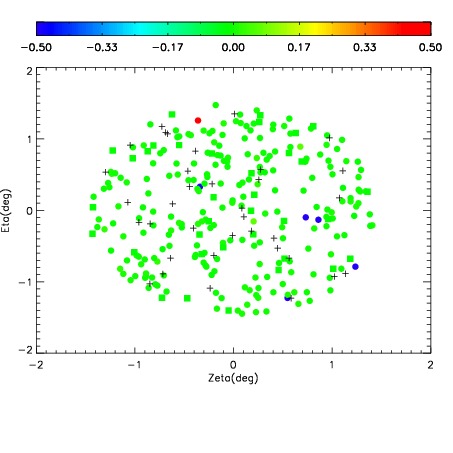
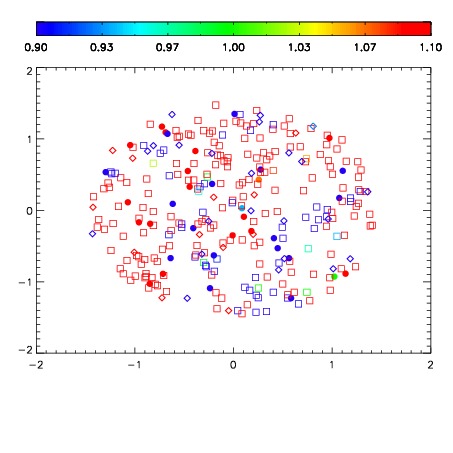


| Frame | Nreads | Zeropoints | Mag plots | Spatial mag deviation | Spatial sky 16325A emission deviations (filled: sky, open: star) | Spatial sky continuum emission | Spatial sky telluric CO2 absorption deviations (filled: H < 10) | |||||||||||||||||||||||
| 0 | 0 |
|
|
|
|
|
|
| IPAIR | NAME | SHIFT | NEWSHIFT | S/N | NAME | SHIFT | NEWSHIFT | S/N |
| 0 | 12310035 | 0.497976 | 0.00000 | 235.723 | 12310036 | 0.00253143 | 0.495445 | 227.578 |
| 1 | 12310034 | 0.497277 | 0.000699013 | 236.374 | 12310033 | 0.00000 | 0.497976 | 234.335 |
| 2 | 12310039 | 0.495683 | 0.00229299 | 215.107 | 12310040 | 0.00135368 | 0.496622 | 219.943 |
| 3 | 12310038 | 0.495583 | 0.00239301 | 211.748 | 12310037 | 0.00243743 | 0.495539 | 218.419 |