| Red | Green | Blue | |
| z | 17.64 | ||
| znorm | Inf | ||
| sky | -Inf | -Inf | -Inf |
| S/N | 29.7 | 50.2 | 53.6 |
| S/N(c) | 0.0 | 0.0 | 0.0 |
| SN(E/C) |

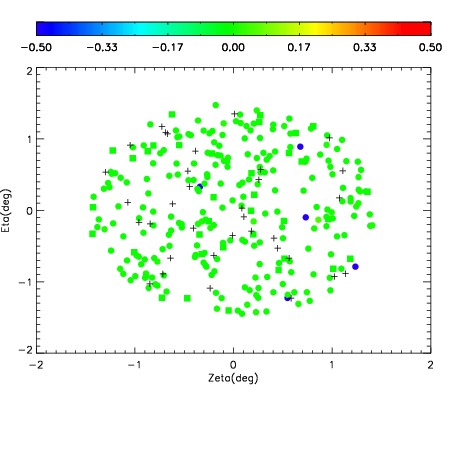
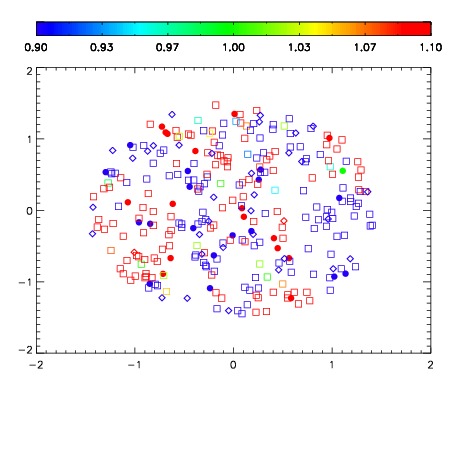


| Frame | Nreads | Zeropoints | Mag plots | Spatial mag deviation | Spatial sky 16325A emission deviations (filled: sky, open: star) | Spatial sky continuum emission | Spatial sky telluric CO2 absorption deviations (filled: H < 10) | |||||||||||||||||||||||
| 0 | 0 |
|
|
|
|
|
|
| IPAIR | NAME | SHIFT | NEWSHIFT | S/N | NAME | SHIFT | NEWSHIFT | S/N |
| 0 | 12550028 | 0.493966 | 0.00000 | 245.136 | 12550033 | -0.000866801 | 0.494833 | 241.038 |
| 1 | 12550032 | 0.492286 | 0.00168002 | 248.626 | 12550026 | 0.00000 | 0.493966 | 247.257 |
| 2 | 12550027 | 0.493768 | 0.000198007 | 248.002 | 12550030 | -0.000962877 | 0.494929 | 245.337 |
| 3 | 12550031 | 0.492104 | 0.00186202 | 245.901 | 12550029 | -0.00103159 | 0.494998 | 242.346 |