| Red | Green | Blue | |
| z | 17.64 | ||
| znorm | Inf | ||
| sky | -Inf | -Inf | -Inf |
| S/N | 19.3 | 35.1 | 37.5 |
| S/N(c) | 0.0 | 0.0 | 0.0 |
| SN(E/C) |
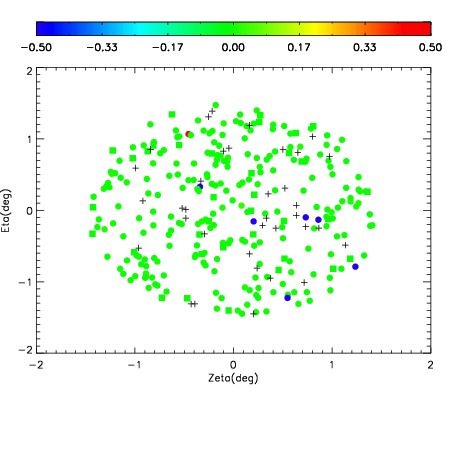
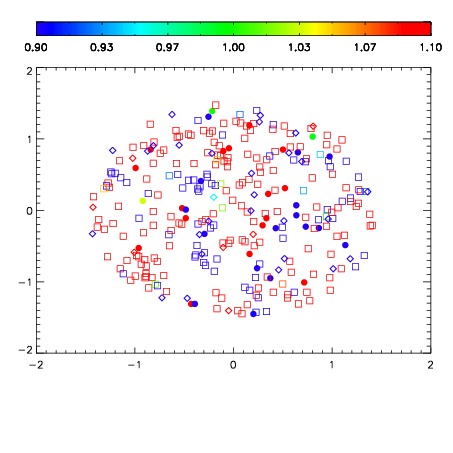
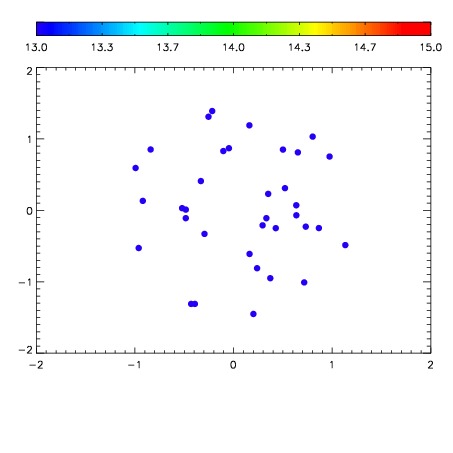

| Frame | Nreads | Zeropoints | Mag plots | Spatial mag deviation | Spatial sky 16325A emission deviations (filled: sky, open: star) | Spatial sky continuum emission | Spatial sky telluric CO2 absorption deviations (filled: H < 10) | |||||||||||||||||||||||
| 0 | 0 |
|
|
|
|
|
|
| IPAIR | NAME | SHIFT | NEWSHIFT | S/N | NAME | SHIFT | NEWSHIFT | S/N |
| 0 | 12240039 | 0.492575 | 0.00000 | 200.724 | 12240040 | -0.00217297 | 0.494748 | 224.708 |
| 1 | 12240038 | 0.491888 | 0.000687003 | 198.371 | 12240037 | -0.00106628 | 0.493641 | 215.590 |
| 2 | 12240035 | 0.492181 | 0.000393987 | 143.023 | 12240036 | -0.00114092 | 0.493716 | 190.625 |
| 3 | 12240034 | 0.492127 | 0.000447989 | 99.9740 | 12240033 | 0.00000 | 0.492575 | 154.397 |