| Red | Green | Blue | |
| z | 17.64 | ||
| znorm | Inf | ||
| sky | -Inf | -Inf | -Inf |
| S/N | 26.1 | 40.9 | 43.3 |
| S/N(c) | 0.0 | 0.0 | 0.0 |
| SN(E/C) |
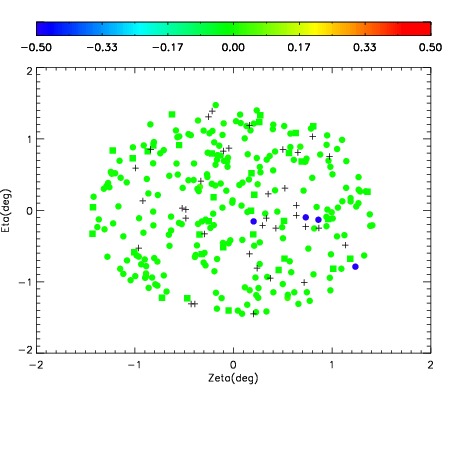
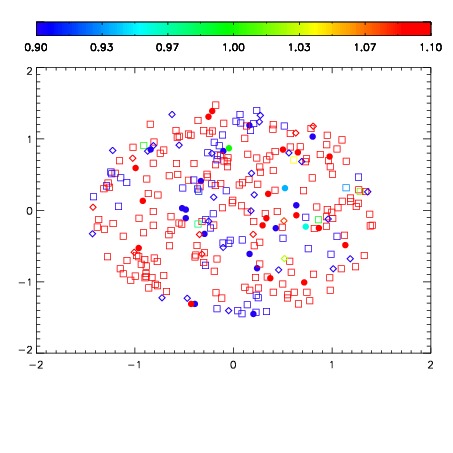
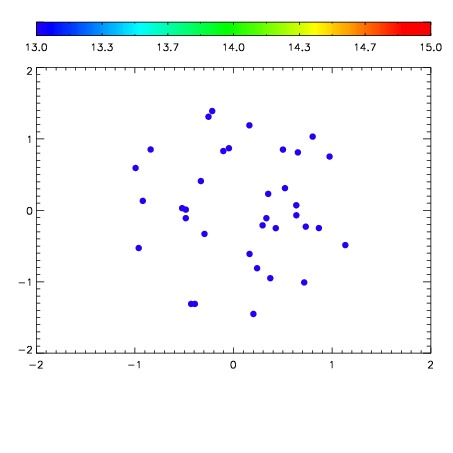

| Frame | Nreads | Zeropoints | Mag plots | Spatial mag deviation | Spatial sky 16325A emission deviations (filled: sky, open: star) | Spatial sky continuum emission | Spatial sky telluric CO2 absorption deviations (filled: H < 10) | |||||||||||||||||||||||
| 0 | 0 |
|
|
|
|
|
|
| IPAIR | NAME | SHIFT | NEWSHIFT | S/N | NAME | SHIFT | NEWSHIFT | S/N |
| 0 | 12300012 | 0.494484 | 0.00000 | 222.715 | 12300015 | -0.00214632 | 0.496630 | 229.372 |
| 1 | 12300013 | 0.494311 | 0.000173002 | 227.126 | 12300014 | -0.00196686 | 0.496451 | 232.831 |
| 2 | 12300016 | 0.493865 | 0.000618994 | 219.609 | 12300011 | 0.00000 | 0.494484 | 212.474 |
| 3 | 12300017 | 0.494012 | 0.000472009 | 214.146 | 12300018 | -0.00133673 | 0.495821 | 211.666 |