| Red | Green | Blue | |
| z | 17.65 | ||
| znorm | Inf | ||
| sky | -Inf | -Inf | -Inf |
| S/N | 23.1 | 42.7 | 43.9 |
| S/N(c) | 0.0 | 0.0 | 0.0 |
| SN(E/C) |
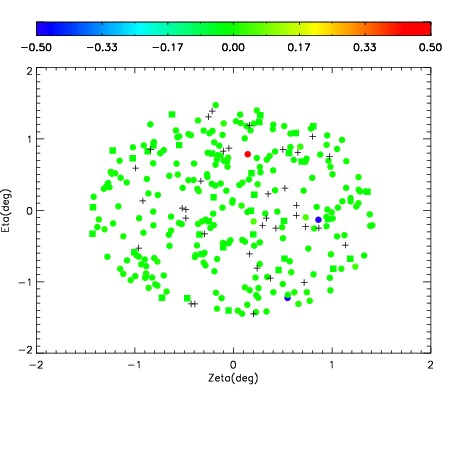
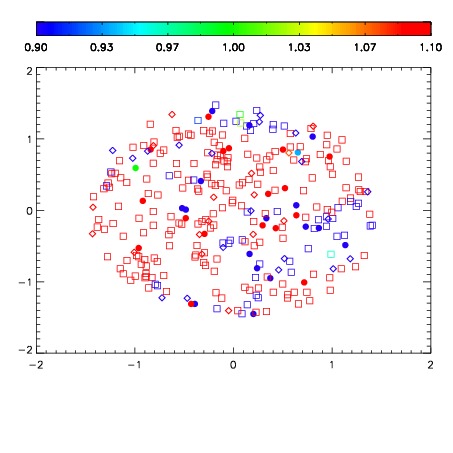
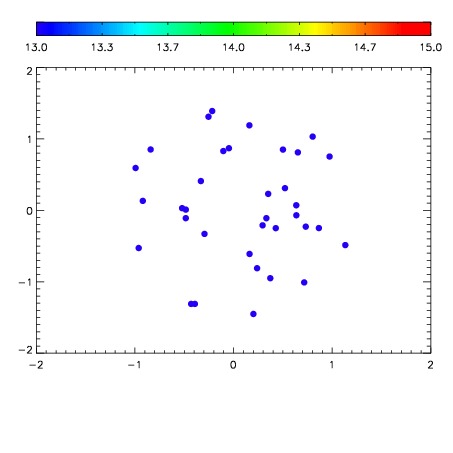

| Frame | Nreads | Zeropoints | Mag plots | Spatial mag deviation | Spatial sky 16325A emission deviations (filled: sky, open: star) | Spatial sky continuum emission | Spatial sky telluric CO2 absorption deviations (filled: H < 10) | |||||||||||||||||||||||
| 0 | 0 |
|
|
|
|
|
|
| IPAIR | NAME | SHIFT | NEWSHIFT | S/N | NAME | SHIFT | NEWSHIFT | S/N |
| 0 | 12540031 | 0.490700 | 0.00000 | 191.495 | 12540033 | 0.000549451 | 0.490151 | 181.591 |
| 1 | 12540027 | 0.489838 | 0.000862002 | 197.902 | 12540026 | 0.00000 | 0.490700 | 226.832 |
| 2 | 12540028 | 0.489813 | 0.000887007 | 187.509 | 12540030 | 0.000137742 | 0.490562 | 181.244 |
| 3 | 12540032 | 0.490319 | 0.000380993 | 181.589 | 12540029 | 0.000618793 | 0.490081 | 166.102 |