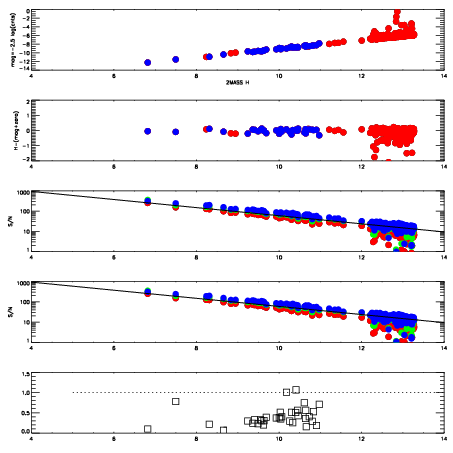
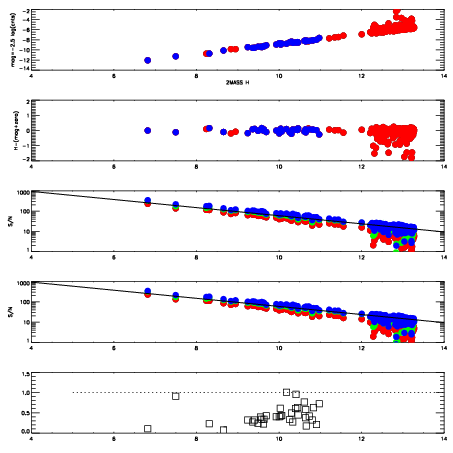
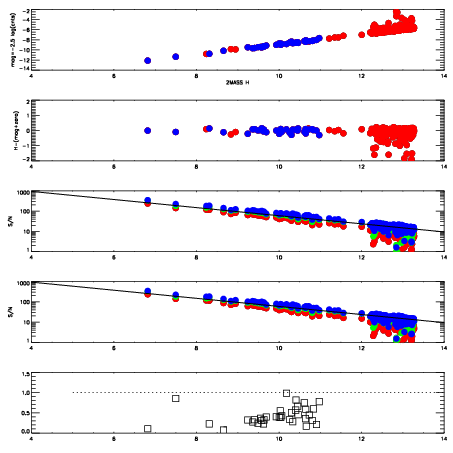
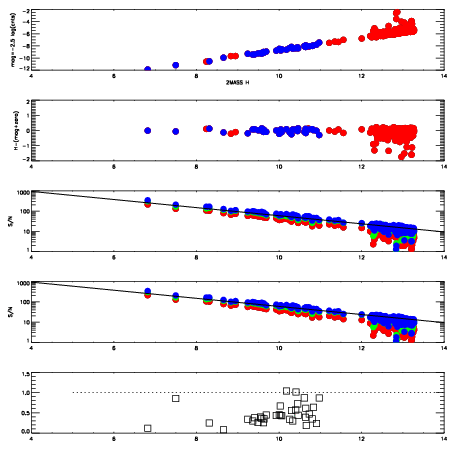
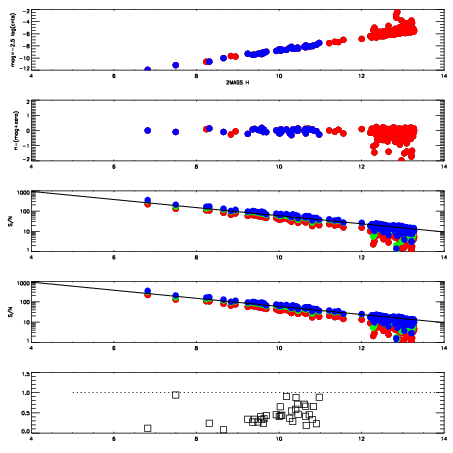
| Frame | Nreads | Zeropoints | Mag plots
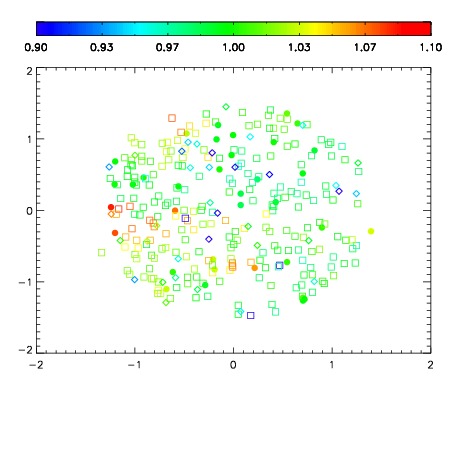
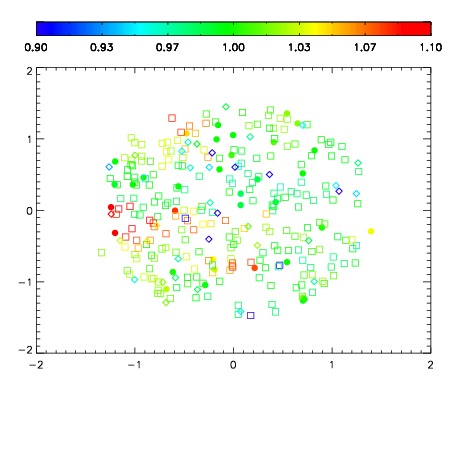
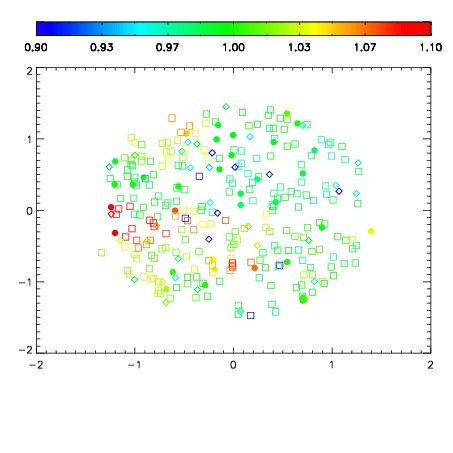
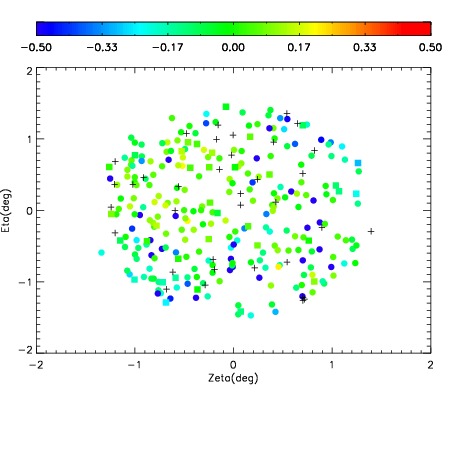
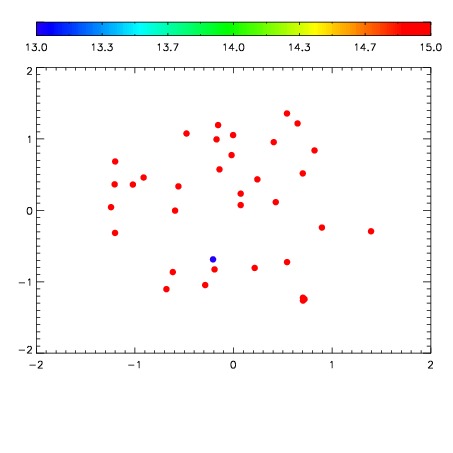
| Spatial mag deviation
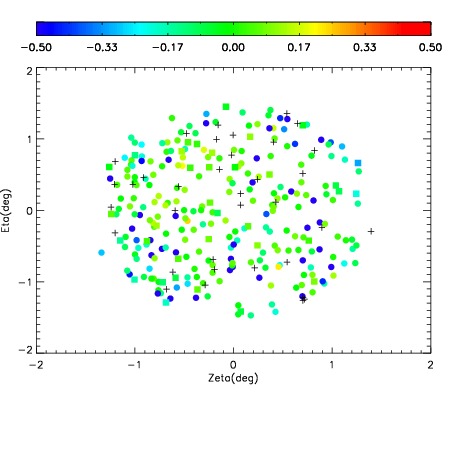
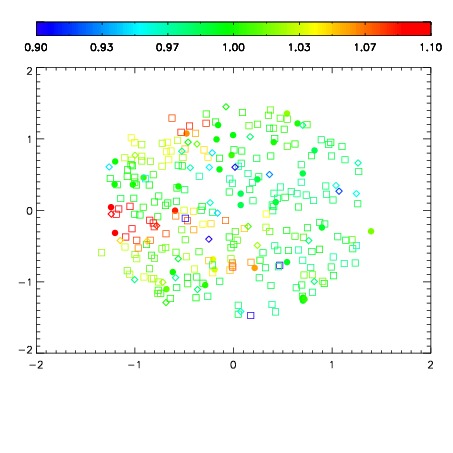
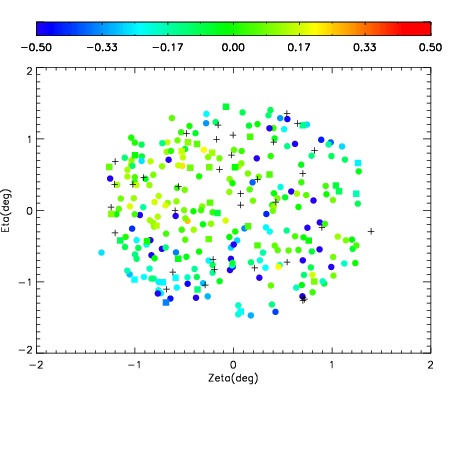
| Spatial sky 16325A emission deviations (filled: sky, open: star)
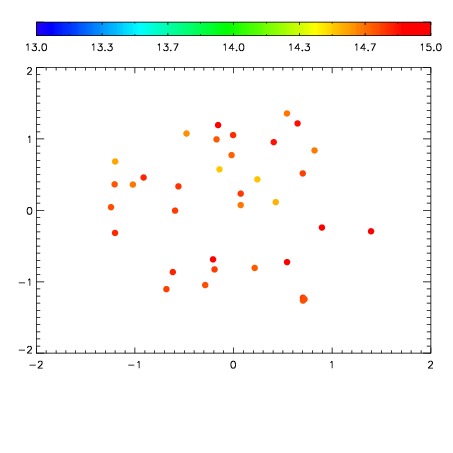
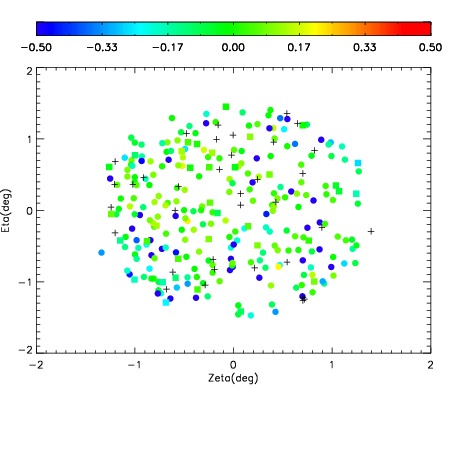
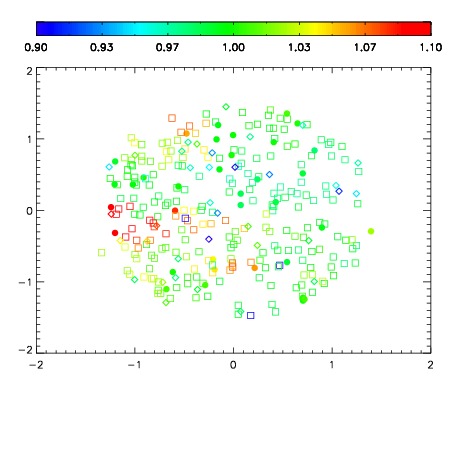
| Spatial sky continuum emission
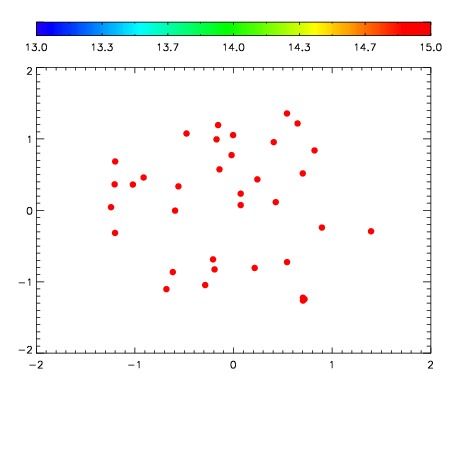
| Spatial sky telluric CO2 absorption deviations (filled: H < 10)
|
| 12000033
| 47
| | Red | Green | Blue
| | z | | 19.05
| | znorm | | 14.87
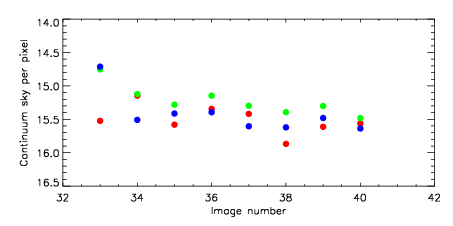
| | sky | 15.5 | 14.8 | 14.7
| | S/N | 19.0 | 29.4 | 31.7
| | S/N(c) | 17.4 | 28.0 | 30.3
| | SN(E/C) 0.38
|
| 
| 
| 
| 
| 
|
| 12000034
| 47
| | Red | Green | Blue
| | z | | 19.10
| | znorm | | 14.92
| | sky | 15.1 | 15.1 | 15.5
| | S/N | 19.4 | 29.9 | 32.6
| | S/N(c) | 17.7 | 28.4 | 31.2
| | SN(E/C) 0.36
|
| 
| 
| 
| 
| 
|
| 12000035
| 47
| | Red | Green | Blue
| | z | | 19.04
| | znorm | | 14.86
| | sky | 15.6 | 15.3 | 15.4
| | S/N | 18.2 | 28.8 | 31.3
| | S/N(c) | 16.7 | 27.4 | 30.0
| | SN(E/C) 0.37
|
| 
| 
| 
| 
| 
|
| 12000036
| 47
| | Red | Green | Blue
| | z | | 18.86
| | znorm | | 14.68
| | sky | 15.3 | 15.1 | 15.4
| | S/N | 16.3 | 26.3 | 28.6
| | S/N(c) | 15.0 | 25.0 | 27.3
| | SN(E/C) 0.40
|
| 
| 
| 
| 
| 
|
| 12000037
| 47
| | Red | Green | Blue
| | z | | 18.93
| | znorm | | 14.75
| | sky | 15.4 | 15.3 | 15.6
| | S/N | 17.2 | 27.5 | 29.7
| | S/N(c) | 15.7 | 26.1 | 28.3
| | SN(E/C) 0.38
|
| 
| 
| 
| 
| 
|
| 12000038
| 47
| | Red | Green | Blue
| | z | | 18.72
| | znorm | | 14.54
| | sky | 15.9 | 15.4 | 15.6
| | S/N | 15.4 | 25.0 | 27.0
| | S/N(c) | 13.9 | 23.6 | 25.6
| | SN(E/C) 0.43
|
| 
| 
| 
| 
| 
|
| 12000039
| 47
| | Red | Green | Blue
| | z | | 18.76
| | znorm | | 14.58
| | sky | 15.6 | 15.3 | 15.5
| | S/N | 15.8 | 25.4 | 27.3
| | S/N(c) | 14.3 | 23.9 | 25.9
| | SN(E/C) 0.42
|
| 
| 
| 
| 
| 
|
| 12000040
| 47
| | Red | Green | Blue
| | z | | 18.69
| | znorm | | 14.51
| | sky | 15.6 | 15.5 | 15.6
| | S/N | 14.7 | 24.3 | 26.1
| | S/N(c) | 13.3 | 22.9 | 24.8
| | SN(E/C) 0.42
|
| 
| 
| 
| 
| 
|