| Red | Green | Blue | |
| z | 17.64 | ||
| znorm | Inf | ||
| sky | -Inf | -Inf | -Inf |
| S/N | 31.2 | 51.4 | 56.0 |
| S/N(c) | 0.0 | 0.0 | 0.0 |
| SN(E/C) |
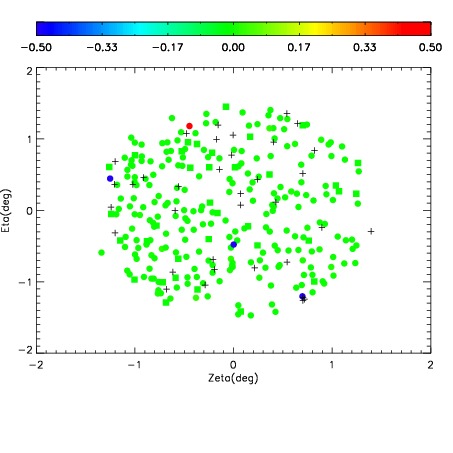
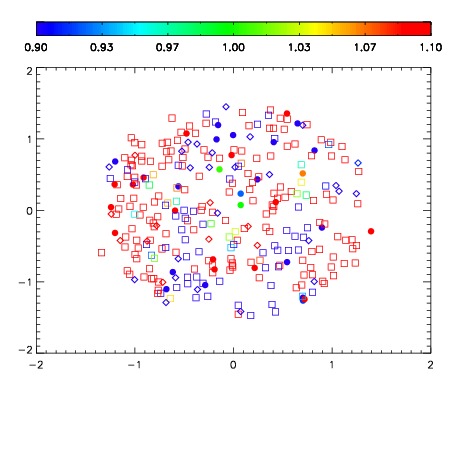
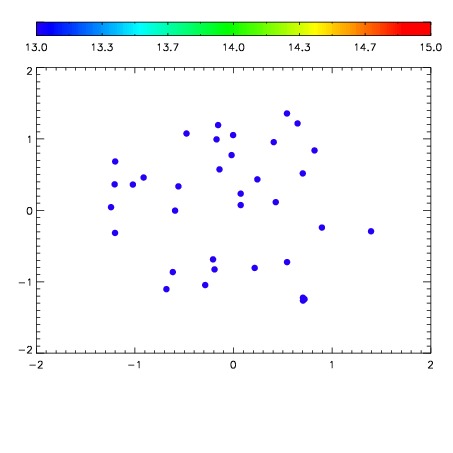

| Frame | Nreads | Zeropoints | Mag plots | Spatial mag deviation | Spatial sky 16325A emission deviations (filled: sky, open: star) | Spatial sky continuum emission | Spatial sky telluric CO2 absorption deviations (filled: H < 10) | |||||||||||||||||||||||
| 0 | 0 |
|
|
|
|
|
|
| IPAIR | NAME | SHIFT | NEWSHIFT | S/N | NAME | SHIFT | NEWSHIFT | S/N |
| 0 | 12000035 | 0.503453 | 0.00000 | 154.372 | 12000037 | -0.00147149 | 0.504925 | 147.243 |
| 1 | 12000034 | 0.503088 | 0.000365019 | 158.507 | 12000033 | 0.00000 | 0.503453 | 154.600 |
| 2 | 12000039 | 0.503114 | 0.000339031 | 135.491 | 12000036 | -0.000957129 | 0.504410 | 142.936 |
| 3 | 12000038 | 0.502832 | 0.000621021 | 133.878 | 12000040 | -0.000358215 | 0.503811 | 131.912 |