| Red | Green | Blue | |
| z | 17.64 | ||
| znorm | Inf | ||
| sky | -Inf | -Inf | -Inf |
| S/N | 24.5 | 40.4 | 43.6 |
| S/N(c) | 0.0 | 0.0 | 0.0 |
| SN(E/C) |
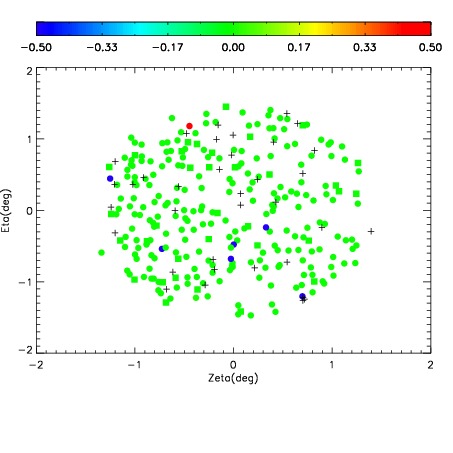
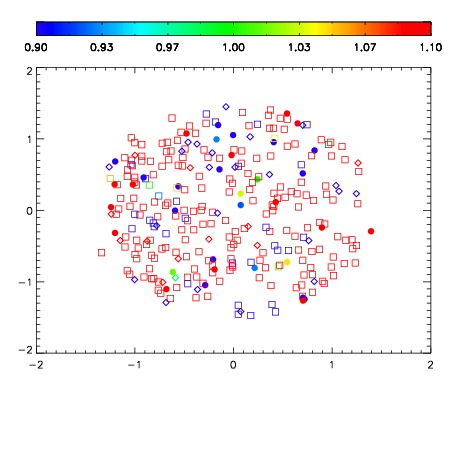
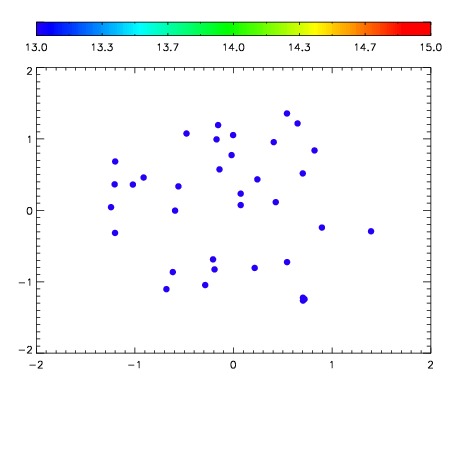

| Frame | Nreads | Zeropoints | Mag plots | Spatial mag deviation | Spatial sky 16325A emission deviations (filled: sky, open: star) | Spatial sky continuum emission | Spatial sky telluric CO2 absorption deviations (filled: H < 10) | |||||||||||||||||||||||
| 0 | 0 |
|
|
|
|
|
|
| IPAIR | NAME | SHIFT | NEWSHIFT | S/N | NAME | SHIFT | NEWSHIFT | S/N |
| 0 | 12090051 | 0.496289 | 0.00000 | 136.617 | 12090049 | 0.00000 | 0.496289 | 133.544 |
| 1 | 12090055 | 0.494691 | 0.00159800 | 143.831 | 12090056 | 0.00110869 | 0.495180 | 144.629 |
| 2 | 12090050 | 0.496057 | 0.000232011 | 140.019 | 12090053 | -0.000235583 | 0.496525 | 138.474 |
| 3 | 12090054 | 0.495365 | 0.000924021 | 139.532 | 12090052 | -0.000527598 | 0.496817 | 137.975 |