| Red | Green | Blue | |
| z | 17.65 | ||
| znorm | Inf | ||
| sky | -Inf | -Inf | -Inf |
| S/N | 17.4 | 32.8 | 34.0 |
| S/N(c) | 0.0 | 0.0 | 0.0 |
| SN(E/C) |
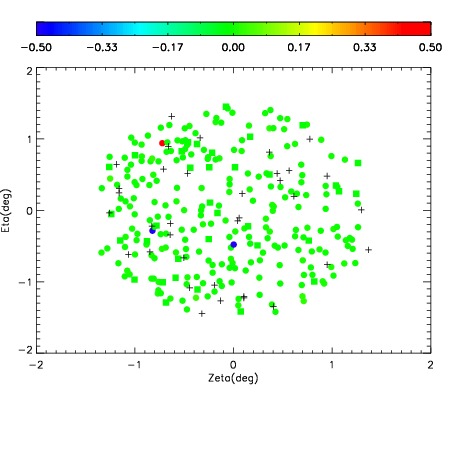
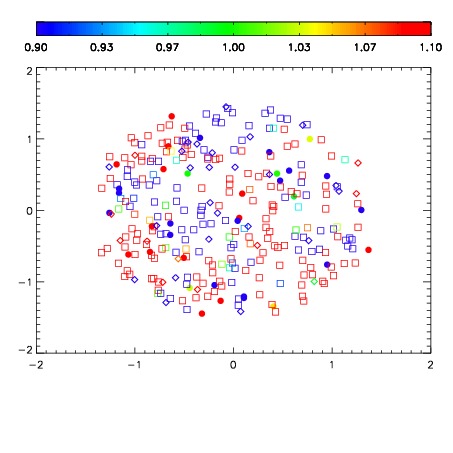
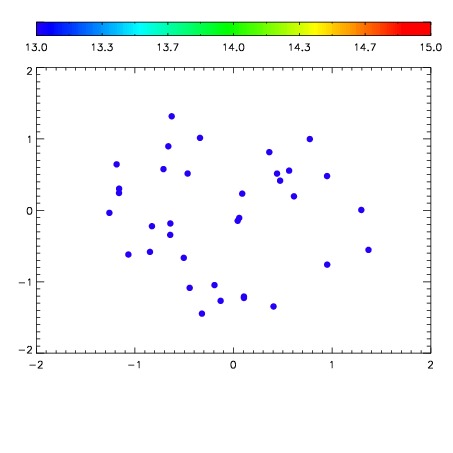

| Frame | Nreads | Zeropoints | Mag plots | Spatial mag deviation | Spatial sky 16325A emission deviations (filled: sky, open: star) | Spatial sky continuum emission | Spatial sky telluric CO2 absorption deviations (filled: H < 10) | |||||||||||||||||||||||
| 0 | 0 |
|
|
|
|
|
|
| IPAIR | NAME | SHIFT | NEWSHIFT | S/N | NAME | SHIFT | NEWSHIFT | S/N |
| 0 | 12280028 | 0.499490 | 0.00000 | 70.4854 | 12280029 | 0.00426632 | 0.495224 | 61.0610 |
| 1 | 12280023 | 0.498658 | 0.000831991 | 121.201 | 12280022 | 0.00000 | 0.499490 | 120.080 |
| 2 | 12280024 | 0.498900 | 0.000589997 | 106.124 | 12280025 | 0.00123787 | 0.498252 | 116.970 |
| 3 | 12280027 | 0.498410 | 0.00108001 | 82.6482 | 12280026 | 0.000434522 | 0.499055 | 107.888 |