| Red | Green | Blue | |
| z | 17.65 | ||
| znorm | Inf | ||
| sky | -Inf | -Inf | -Inf |
| S/N | 15.4 | 26.1 | 31.2 |
| S/N(c) | 15.4 | 26.1 | 31.2 |
| SN(E/C) |
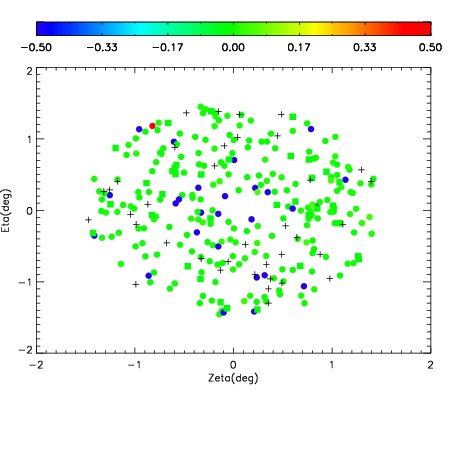
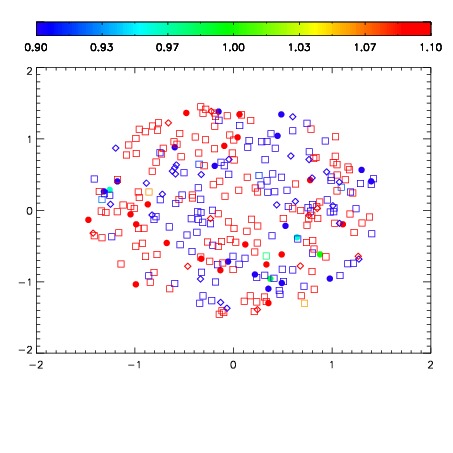
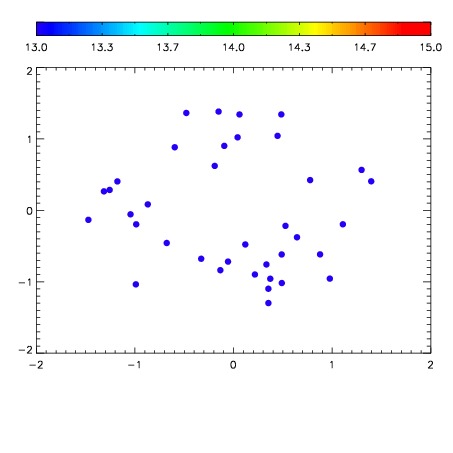

| Frame | Nreads | Zeropoints | Mag plots | Spatial mag deviation | Spatial sky 16325A emission deviations (filled: sky, open: star) | Spatial sky continuum emission | Spatial sky telluric CO2 absorption deviations (filled: H < 10) | |||||||||||||||||||||||
| 0 | 0 |
|
|
|
|
|
|
| IPAIR | NAME | SHIFT | NEWSHIFT | S/N | NAME | SHIFT | NEWSHIFT | S/N |
| 0 | 11970050 | 0.502436 | 0.00000 | 85.8702 | 11970051 | -0.00181967 | 0.504256 | 86.0971 |
| 1 | 11970049 | 0.502109 | 0.000326991 | 140.453 | 11970048 | -0.00291287 | 0.505349 | 138.088 |
| 2 | 11970046 | 0.501821 | 0.000615001 | 125.024 | 11970047 | -0.00216424 | 0.504600 | 136.279 |
| 3 | 11970045 | 0.502019 | 0.000416994 | 113.251 | 11970044 | 0.00000 | 0.502436 | 101.366 |