| Red | Green | Blue | |
| z | 17.65 | ||
| znorm | Inf | ||
| sky | -Inf | -Inf | -Inf |
| S/N | 18.0 | 31.2 | 33.9 |
| S/N(c) | 18.0 | 31.2 | 33.9 |
| SN(E/C) |


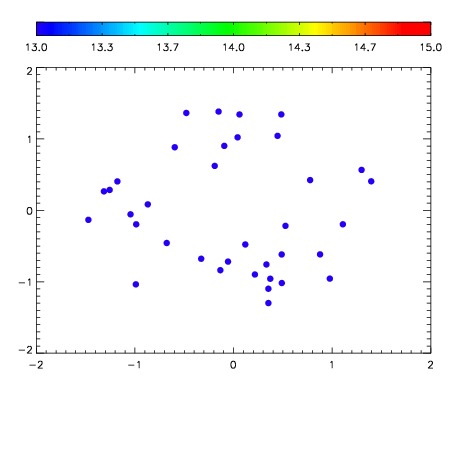

| Frame | Nreads | Zeropoints | Mag plots | Spatial mag deviation | Spatial sky 16325A emission deviations (filled: sky, open: star) | Spatial sky continuum emission | Spatial sky telluric CO2 absorption deviations (filled: H < 10) | |||||||||||||||||||||||
| 0 | 0 |
|
|
|
|
|
|
| IPAIR | NAME | SHIFT | NEWSHIFT | S/N | NAME | SHIFT | NEWSHIFT | S/N |
| 0 | 12030032 | 0.503035 | 0.00000 | 109.380 | 12030033 | 0.000673975 | 0.502361 | 97.7475 |
| 1 | 12030027 | 0.502471 | 0.000563979 | 127.781 | 12030026 | 0.00000 | 0.503035 | 127.754 |
| 2 | 12030031 | 0.502566 | 0.000469029 | 116.217 | 12030030 | -0.000152736 | 0.503188 | 108.887 |
| 3 | 12030028 | 0.502738 | 0.000297010 | 111.393 | 12030029 | -0.000292440 | 0.503327 | 105.833 |