| Red | Green | Blue | |
| z | 17.64 | ||
| znorm | Inf | ||
| sky | -Inf | -Inf | -Inf |
| S/N | 32.6 | 51.9 | 58.7 |
| S/N(c) | 32.6 | 51.9 | 58.7 |
| SN(E/C) |
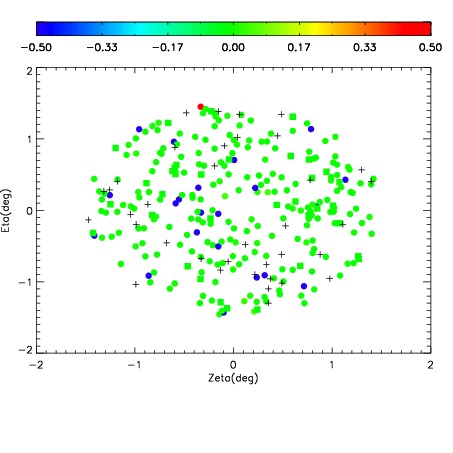
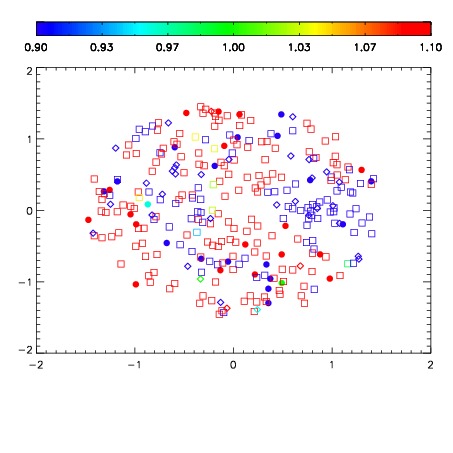


| Frame | Nreads | Zeropoints | Mag plots | Spatial mag deviation | Spatial sky 16325A emission deviations (filled: sky, open: star) | Spatial sky continuum emission | Spatial sky telluric CO2 absorption deviations (filled: H < 10) | |||||||||||||||||||||||
| 0 | 0 |
|
|
|
|
|
|
| IPAIR | NAME | SHIFT | NEWSHIFT | S/N | NAME | SHIFT | NEWSHIFT | S/N |
| 0 | 12240024 | 0.491558 | 0.00000 | 185.569 | 12240022 | 0.00000 | 0.491558 | 186.113 |
| 1 | 12240023 | 0.491460 | 9.79900e-05 | 184.187 | 12240029 | -0.000683651 | 0.492242 | 186.065 |
| 2 | 12240027 | 0.490985 | 0.000572979 | 176.175 | 12240025 | -0.000996931 | 0.492555 | 176.053 |
| 3 | 12240028 | 0.491446 | 0.000111997 | 176.019 | 12240026 | -0.00135699 | 0.492915 | 174.516 |